อ่านรายละเอียดเพิ่มเติม


 20.01.2023 07:10 PM
The expected trend for today: Bullish.
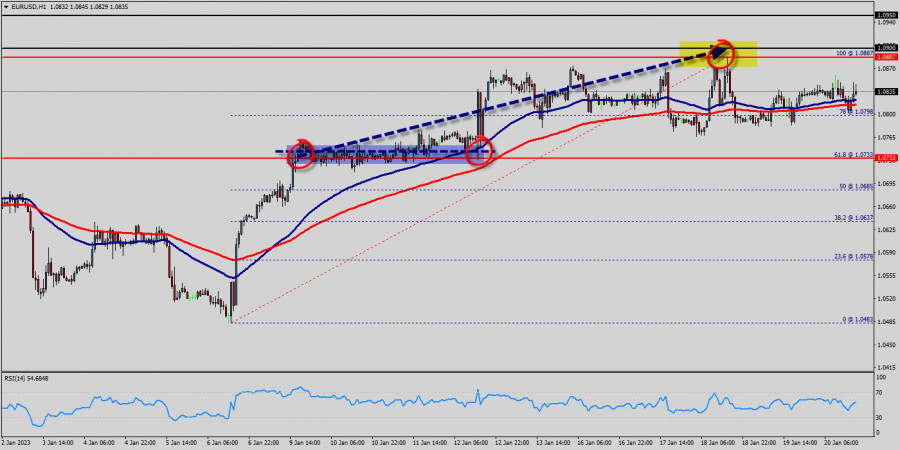
The EUR/USD pair rallied upwards strongly yesterday to breach the bearish channel's resistance and settles above it, opening the way to turn to the upside on the intraday and short-term basis, starting bullish correction for the raise measured from 1.0733 to 1.0835, noting that the first main station is located at 1.0887, which breaching it represents the key to achieve additional gains that reach 1.0900.
Therefore, the bullish bias will be suggested for today, supported by the EMA100 that carries the price from above, taking into consideration that breaking 1.0835 will stop the expected rise and push the price back to the main bearish track again.
A medium term topped could be in place already, on bullish convergence condition in daily RSI.
Intraday bias is now on the upside for 61.8% retracement of 1.0733 to 1.0835 at 1.0887. The EUR/USD pair traded higher and closed the day in the positive territory around 1.0835-1.0887.
On the hourly chart, EUR/USD is still trading above the moving average line MA (100) H1 (1.0835).
Accordingly, the bullish outlook remains the same as long as the EMA 100 is pointing to the uptrend. This suggests that the pair will probably go above the daily pivot point (1.0835) in the coming hours.
The EUR/USD pair will demonstrate strength following a breakout of the high at 1.0835 . The situation is similar on the four-hour chart. Based on the foregoing, it is probably worth sticking to the north direction in trading, and as long as the EUR/USD pair remains above MA100 H1, it may be necessary to look for entry points to buy for the formation of a correction. Probably, the main scenario is continued growth towards 1.0887 (Oct. 26 high). The expected trading range for today is between 1.0733 support and 1.0900 resistance.
Forecast:
Uptrend scenario :
An uptrend will start as soon, as the market rises above resistance level 1.0733, which will be followed by moving up to resistance level 1.0887. Further close above the high end may cause a rally towards 1.0887and 1.0900. Nonetheless, the weekly resistance level and zone should be considered at 1.0900.
Alternative scenario :
On the downside, break of 1.0733 major
support will turn intraday bias neutral first. The breakdown of 1.0733 will allow the pair to down further down to the prices of 1.0700 and 1.0685.
You have already liked this post today
*บทวิเคราะห์ในตลาดที่มีการโพสต์ตรงนี้ เพียงเพื่อทำให้คุณทราบถึงข้อมูล ไม่ได้เป็นการเจาะจงถึงขั้นตอนให้คุณทำการซื้อขายตาม
ในช่วงต้นสัปดาห์ใหม่ คู่สกุลเงิน EUR/USD ได้รับแรงหนุนขึ้นตามการอ่อนค่าของดอลลาร์สหรัฐฯ จากมุมมองทางเทคนิค การทะลุผ่านต่ำกว่าเส้นค่าเฉลี่ยเคลื่อนที่ธรรมดา (Simple Moving Average - SMA) 200 ช่วงบนกราฟ 4 ชั่วโมงเมื่อสัปดาห์ที่ผ่านมา
ช่วงต้นของการซื้อขายในตลาดอเมริกา คู่เงิน EUR/USD กำลังซื้อขายอยู่ที่ประมาณ 1.1266 ซึ่งถึงจุดสูงสุดของช่องขาลงและแสดงสัญญาณของการอ่อนแรง. ในการเปิดตลาดต้นสัปดาห์นี้ เงินยูโรทิ้งช่องว่างที่คาดว่าจะถูกเติมเต็มในไม่กี่วันข้างหน้า สำหรับสิ่งนี้ เราควรคาดการณ์ว่า EUR/USD จะลดลงต่ำกว่า 1.1190. ถ้าราคาลดลงจากระดับปัจจุบัน เครื่องมือทางการเงินอาจเติมเต็มช่องว่างที่ทิ้งไว้ที่
ในช่วงต้นของการซื้อขายในตลาดอเมริกา ทองคำซื้อขายอยู่รอบๆ 3,245 แตะถึงจุดสูงสุดของช่องแนวโน้มขาขึ้น แสดงถึงการหมดแรงของแนวโน้มขาขึ้น ในชั่วโมงข้างหน้า เราเชื่อว่า XAU/USD อาจมีการปรับฐานทางเทคนิคเพื่อลดลงถึง 3,204 ซึ่งเป็นจุดที่ SMA 21 วันตั้งอยู่ นอกจากนี้ยังอาจลงไปถึง
ลิงก์ที่มีประโยชน์: บทความอื่นๆ ของฉันมีให้บริการในส่วนนี้ หลักสูตร InstaForex สำหรับผู้เริ่มต้น การวิเคราะห์ที่ได้รับความนิยม เปิดบัญชีซื้อขาย สำคัญ: ผู้เริ่มต้นในตลาดฟอเร็กซ์ควรระมัดระวังอย่างยิ่งในการตัดสินใจเกี่ยวกับการเข้าสู่ตลาด ก่อนการประกาศรายงานที่สำคัญ ควรหลีกเลี่ยงการเข้าสู่ตลาดเพื่อป้องกันการติดกับดักจากการผันผวนที่รุนแรงเนื่องจากความผันแปรที่เพิ่มขึ้น หากคุณตัดสินใจที่จะทำการซื้อขายในช่วงเวลาของการรายงานข่าว ควรวางคำสั่งหยุดการขาดทุนเสมอเพื่อจำกัดการสูญเสีย หากไม่วางคำสั่งหยุดการขาดทุน
เมื่อวันศุกร์ คู่สกุลเงิน EUR/USD ยังคงปรับตัวลงในระดับปานกลาง การปิดที่ต่ำกว่าระดับ 127.2% ของ Fibonacci ที่ 1.1181 ได้ถูกบันทึกไว้ แต่ฝั่งหมีไม่สามารถใช้ประโยชน์จากความสำเร็จนั้นได้ สถานการณ์ข่าวในปัจจุบันมีทั้งด้านบวกและลบ: ในด้านหนึ่ง สงครามการค้ากำลังเปลี่ยนไปสู่การยุติข้อพิพาท;
ในกราฟรายชั่วโมง คู่สกุลเงิน GBP/USD ยังคงเคลื่อนไหวในทิศทางด้านข้างเมื่อวันศุกร์ โดยผันผวนระหว่างระดับ 1.3205 และ 1.3344 หลังจากการถูกปฏิเสธจากโซนแนวต้านที่ 1.3344–1.3357 ยังมีโอกาสที่จะลดลงต่อไปสู่ระดับฟีโบนักชี 100.0% ที่ 1.3205 อย่างไรก็ตาม
บนกราฟ 4 ชั่วโมง เครื่องมือ Stochastic Oscillator ดูเหมือนกำลังตัดเส้นในสัญญาณซื้อ พร้อมกับการเคลื่อนไหวของราคาที่เหนือกว่าเส้น WMA (21) และการปรากฏตัวของรูปแบบ Bullish 123 ดังนั้นตราบใดที่ยังไม่มีการปรับฐานอ่อนลงที่ฝ่าและปิดต่ำกว่าระดับ 3120.34
แม้ว่าในกราฟ 4 ชั่วโมงของ EUR/JPY ผู้ขายยังคงครอบงำอยู่ ซึ่งได้รับการยืนยันจากการเคลื่อนไหวของราคาที่ยังคงอยู่ต่ำกว่า WMA (21) ซึ่งมีแนวโน้มลดลงด้วยเช่นกัน แต่ด้วยการปรากฏของ Divergence ระหว่างการเคลื่อนไหวของราคา EUR/JPY และตัวบ่งชี้ Stochastic
เมื่อวันศุกร์ที่ผ่านมา เงินยูโรไม่สามารถรักษาการเคลื่อนไหวขาขึ้นได้ แต่ก็ไม่ได้ตกลงต่ำกว่าเส้น MACD ของกราฟรายวัน—วันนั้นปิดด้วยแท่งเทียนสีดำ แต่ยังคงอยู่เหนือขอบบนของช่วง 1.1110/50 วันจันทร์เริ่มต้นด้วยการขยับขึ้นเล็กน้อยและเกิดช่องว่างเล็ก ๆ อีกครั้ง, ซึ่งอยู่ใกล้กับเส้น MACD หลังจากช่องว่างปิดลงอย่างรวดเร็ว ราคามีแนวโน้มสูงขึ้นสู่ระดับเป้าหมายที่ 1.1266
เมื่อวันศุกร์ที่ผ่านมา เงินปอนด์อังกฤษไม่สามารถทะลุระดับแนวต้านที่ 1.3311 ได้ แม้กระทั่งรูปแบบ "หัวและไหล่" บนเครื่องมือ Oscillator ของ Marlin ก็ไม่สามารถช่วยได้เช่นกัน ทำให้ราคายังคงเคลื่อนไหวไปด้านข้างต่ำกว่าระดับ 1.3311 แต่วันนี้ ปอนด์เริ่มต้นวันด้วยเจตนาที่จะเอาชนะแนวต้านที่ยืดเยื้อ
Your IP address shows that you are currently located in the USA. If you are a resident of the United States, you are prohibited from using the services of InstaFintech Group including online trading, online transfers, deposit/withdrawal of funds, etc.
If you think you are seeing this message by mistake and your location is not the US, kindly proceed to the website. Otherwise, you must leave the website in order to comply with government restrictions.
Why does your IP address show your location as the USA?
Please confirm whether you are a US resident or not by clicking the relevant button below. If you choose the wrong option, being a US resident, you will not be able to open an account with InstaTrade anyway.
We are sorry for any inconvenience caused by this message.

