อ่านรายละเอียดเพิ่มเติม


 26.04.2023 12:26 AM
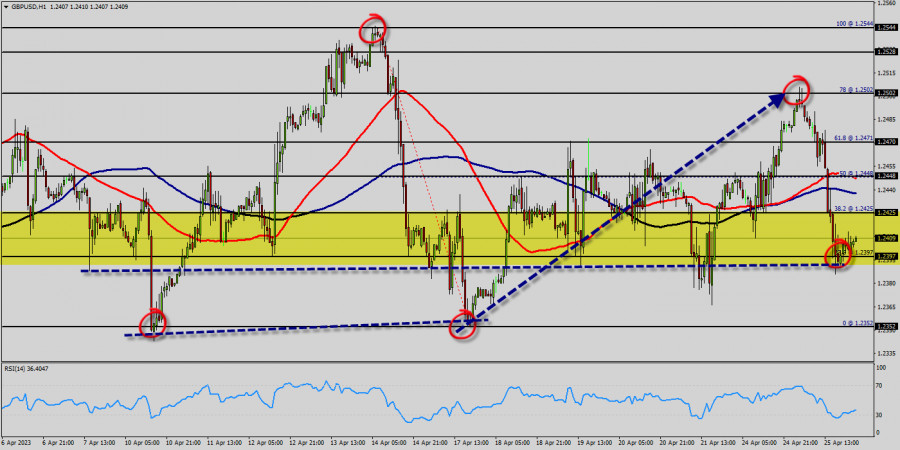
The bullish trend is currently very strong on The GBP/USD pair. As long as the price remains above the support levels of 1.2397, you could try to benefit from the growth. The first bullish objective is located at the price of 1.2425. The bullish momentum would be boosted by a break in this resistance (1.2425).
The hourly chart is currently still bullish. At the same time, some stabilization tendencies are visible between 1.2397 and 1.2035. Together with the relatively large distance to the fast-rising 100-day moving average (1.2035), there are some arguments for a relief rally in coming months on the table.
The GBP/USD pair is at highest against the dollar around the spot of 1.2035 since last week. The GBP/USD pair is inside in upward channel. For some weeks the GBP/USD pair decreased within an up channel, for that the GBP/USD pair its new highest 1.2067. Consequently, the first support is set at the level of 1.2035. Hence, the market is likely to show signs of a bullish trend around the area of 1.2000 and 1.2035.
RSI is seeing major support above 33% and a bullish divergence vs price also signals that a reversal is impending. According to the previous events the price is expected to remain between 1.2425 and 1.2397 levels. Buyers would then use the next resistance located at 1.2067 as an objective. Crossing it would then enable buyers to target 1.2502 (the double top - last bullish week).
Be careful, given the powerful bullish rally underway, excesses could lead to a possible correction in the short term. If this is the case, remember that trading against the trend may be riskier. It would seem more appropriate to wait for a signal indicating reversal of the trend. The GBP/USD pair has plunged up for a fresh two weeks high.
Prices pushed above a key retracement from a Fibonacci setup that spans from the lowest price of 1.2397 (23.6% of Fibonacci on the hourly chart), for that buyer pulled the bid back-above that level by the end of the week.
This week, the GBP/USD pair traded up and closed the day in the red area near the price of 1.2397. Today it rose a little, rising above 1.2397. If the pair succeeds in passing through the level of 1.2425, the market will indicate the bullish opportunity above the level of 1.2425 in order to reach the second target at 1.2501.
In the very short term, the general bullish sentiment is confirmed by technical indicators. Therefore, a small upwards rebound in the very short term could occur in case of excessive bearish movements. The trend is still bullish as long as the price of 1.2397 is not broken. Thereupon, it would be wise to re-buy above the price of at 1.2397 with the objective of 1.2352. We should see the pair climbing towards the next target of 1.2300. The pair will move upwards continuing the development of the bullish trend to the level 1.2501 or 1.2544 in coming days.
You have already liked this post today
*บทวิเคราะห์ในตลาดที่มีการโพสต์ตรงนี้ เพียงเพื่อทำให้คุณทราบถึงข้อมูล ไม่ได้เป็นการเจาะจงถึงขั้นตอนให้คุณทำการซื้อขายตาม
ในกราฟ 4 ชั่วโมง เครื่องมือที่ใช้สำหรับการซื้อขายเงิน (Silver) แสดงให้เห็นสภาพที่กำลังแข็งแกร่งขึ้น ซึ่งยืนยันได้จากการเคลื่อนไหวของราคาเงินที่เคลื่อนที่อยู่เหนือเส้น WMA (30 Shift 2) ที่มีแนวโน้มขึ้น แต่การปรากฎของ Divergence ระหว่างการเคลื่อนที่ของราคาและตัวบ่งชี้
แม้ว่าในกราฟ 4 ชั่วโมง ดัชนี Nasdaq 100 จะอยู่ในทิศทาง Sideways แต่ช่วงช่วงนั้นค่อนข้างกว้างจึงยังมีโอกาสที่ค่อนข้างน่าสนใจในดัชนีนี้ ขณะนี้ตัวชี้วัด Stochastic Oscillator อยู่ในสภาวะ Crossing SELL
ในช่วงต้นของตลาดสหรัฐฯ ทองคำมีการซื้อขายอยู่ที่ประมาณ 3,333 ภายในช่องขาลงที่เกิดขึ้นเมื่อวันที่ 22 เมษายน XAU/USD แสดงสัญญาณของการขายเกินและกำลังกระเด้งหลังจากถึงระดับ Murray 6/8 และพื้นที่ 200 EMA ทองคำอาจจะยังคงอยู่ในแนวโน้มขาลง ถ้ามันลดลงต่ำกว่า
ด้วยการเกิดความแตกต่างระหว่างการเคลื่อนไหวของราคาในคู่สกุลเงิน AUD/JPY กับตัวบ่งชี้ Stochastic Oscillator และการเคลื่อนไหวของราคา AUD/JPY ที่อยู่เหนือ WMA (30 Shift 2) ซึ่งมีแนวโน้มสูงขึ้น ดังนั้นอิงตามข้อเท็จจริงทั้งสองข้อนี้ AUD/JPY
หากเราพิจารณากราฟ 4 ชั่วโมง จะเห็นว่าเครื่องมือการเงิน Gold ยังคงเคลื่อนไหวในแนวโน้ม Bullish แต่การปรากฏของ Divergence ระหว่างการเคลื่อนไหวของราคาทองคำกับตัวชี้วัด Stochastic Oscillator บ่งบอกว่าในอนาคตอันใกล้นี้ ทองคำอาจเผชิญการปรับฐานอ่อนตัวลงไปสู่ระดับ 3310.31
ลิงก์ที่เป็นประโยชน์: บทความอื่นๆ ของฉันสามารถอ่านได้ในส่วนนี้ คอร์สพื้นฐาน InstaForex สำหรับผู้เริ่มต้น การวิเคราะห์ยอดนิยม เปิดบัญชีซื้อขาย สำคัญ: สำหรับผู้เริ่มต้นในการเทรดฟอเร็กซ์ ควรระมัดระวังเป็นพิเศษเมื่อทำการตัดสินใจเกี่ยวกับการเข้าสู่ตลาด ก่อนที่รายงานสำคัญจะออก ควรหลีกเลี่ยงการเข้าตลาดเพื่อป้องกันการถูกกระทบจากความผันผวนของตลาดที่เพิ่มขึ้น หากตัดสินใจเทรดในช่วงที่มีการประกาศข่าว ควรตั้ง
หากเราพิจารณากราฟ 4 ชั่วโมงของคู่สกุลเงิน GBP/CHF จะพบข้อเท็จจริงที่น่าสนใจหลายประการ ประการแรก การปรากฏตัวของรูปแบบ Triangle ตามด้วยการเคลื่อนไหวของ EMA (21) ที่เคลื่อนที่ระหว่างตัวแท่งเทียนบ่งชี้ว่าสถานการณ์ปัจจุบันของ GBP/CHF กำลังเคลื่อนที่ในลักษณะ Sideways
ด้วยการเคลื่อนไหวของราคาคู่เงินตรา AUD/CAD ที่เคลื่อนขึ้นเหนือเส้น WMA (21) ที่มีความชันไปทางขาขึ้น และการปรากฏของสัญญาณการบรรจบกันระหว่างการเคลื่อนไหวของราคา AUD/CAD กับตัวบ่งชี้ Stochastic Oscillator นั้นแสดงให้เห็นว่ามีโอกาสที่ในอนาคตอันใกล้จะแข็งค่าขึ้นไปถึงระดับ 0.8896 หากสามารถทะลุระดับนี้ไปได้และปิดสูงกว่า ก็จะทำให้
ในช่วงต้นของการซื้อขายในสหรัฐอเมริกา ทองคำกำลังเคลื่อนที่ในทางขาขึ้นอย่างแข็งแรงหลังวันหยุดอีสเตอร์ ถึงระดับสูงสุดตลอดกาลใหม่ที่ประมาณ 3,406 ทางเทคนิคแล้ว ทองคำมีศักยภาพในการขึ้นไปได้สูง และมีแนวโน้มที่จะถึงจุดสูงสุดในแนวโน้มขาขึ้นระหว่าง 3,422 และ 3,430 บริเวณนี้เป็นจุดสำคัญเนื่องจากทองคำอาจเจอแรงต่อต้านรุนแรง ซึ่งอาจถือเป็นโอกาสในการขาย อย่างไรก็ตาม เราเชื่อว่าทองคำอาจกลับไปที่ระดับ 3,330
จากที่เห็นในกราฟ 4 ชั่วโมง คู่สกุลเงิน EUR/GBP ดูเหมือนจะเคลื่อนไหวเหนือเส้น EMA (100) ซึ่งบ่งบอกว่าผู้ซื้อมีอิทธิพลเหนือคู่สกุลเงินนี้ ดังนั้นในอนาคตอันใกล้ ตราบใดที่ไม่มีการแก้ไขที่อ่อนแอที่ทะลุและปิดต่ำกว่าระดับ 0.8521 EUR/GBP มีโอกาสที่จะคุ้มค่าและเพิ่มขึ้นถึงระดับ 0.8613
ตารางของ Forex
เวอร์ชั่นแบบ หน้าเว็บไซต์

Your IP address shows that you are currently located in the USA. If you are a resident of the United States, you are prohibited from using the services of InstaFintech Group including online trading, online transfers, deposit/withdrawal of funds, etc.
If you think you are seeing this message by mistake and your location is not the US, kindly proceed to the website. Otherwise, you must leave the website in order to comply with government restrictions.
Why does your IP address show your location as the USA?
Please confirm whether you are a US resident or not by clicking the relevant button below. If you choose the wrong option, being a US resident, you will not be able to open an account with InstaTrade anyway.
We are sorry for any inconvenience caused by this message.

