อ่านรายละเอียดเพิ่มเติม


 30.11.2023 12:05 PM
Overview :
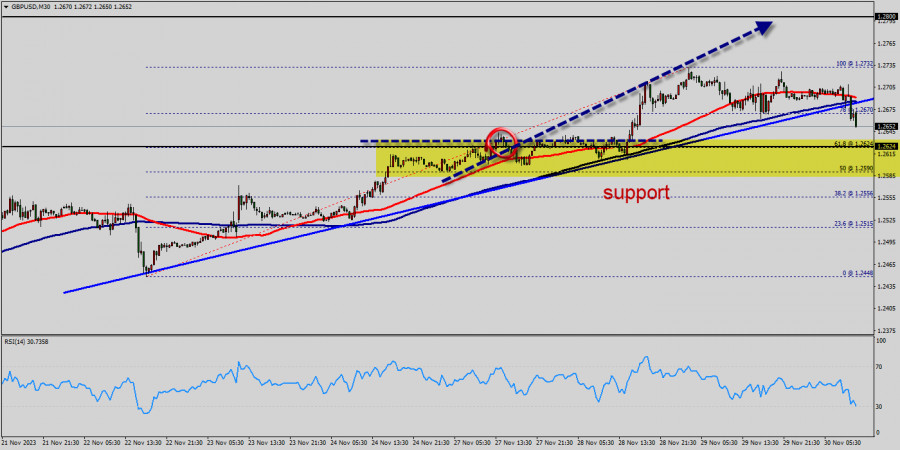
The GBP/USD pair is going to continue to rise from the level of 1.2624 in the long term. It should be noted that the support is established at the level of 1.2624 which represents the 61.8% Fibonacci retracement level on the M30 chart.
The price is likely to form a double bottom in the same time frame. Accordingly, the GBP/USD pair is showing signs of strength following a breakout of the highest level of 1.2624.
The GBP/USD pair faced strong support at the level of 1.2624 because resistance became support. So, the strong support has already faced at the level of 1.2624 and the pair is likely to try to approach it in order to test it again.
The level of 1.2624 represents a weekly pivot point for that it is acting as major support this week. Furthermore, the GBP/USD pair is continuing to trade in a bullish trend from the new support level of 1.2624. It should be noted that the RSI is still above 30.
Currently, the price is in a bullish channel. According to the previous events, we expect the GBP/USD pair to move between 1.2624 and 1.2800.
So, buy above the level of 1.2624 with the first target at 1.2732 in order to test the daily resistance 1 and further to 1.2800. Also, it might be noted that the level of 1.2800 is a good place to take profit because it will form a double top.
On the other hand, in case a reversal takes place and the GBP/USD pair breaks through the support level of 1.2624, a further decline to 1.2556 can occur which would indicate a bearish market.
You have already liked this post today
*บทวิเคราะห์ในตลาดที่มีการโพสต์ตรงนี้ เพียงเพื่อทำให้คุณทราบถึงข้อมูล ไม่ได้เป็นการเจาะจงถึงขั้นตอนให้คุณทำการซื้อขายตาม
ในวันพุธ คู่เงิน EUR/USD ได้ปรับตัวขึ้นสู่แนวต้านบริเวณ 1.1265–1.1282 จากนั้นก็พลิกกลับไปในทิศทางที่เป็นประโยชน์ต่อดอลลาร์สหรัฐ ซึ่งสามารถเพิ่มขึ้นได้ประมาณ 80 จุดภายในสิ้นวัน จุดนี้การเพิ่มขึ้นของดอลลาร์นั้นถือว่าเป็นเหตุการณ์ที่น่ายินดีอยู่แล้ว แต่เทรดเดอร์ยังคงไม่กล้าลงทุนในดอลลาร์สหรัฐ เนื่องจาก "ปัจจัยของทรัมป์" ยังคงมีผลกระทบอยู่ กล่าวคือ
ในกราฟรายชั่วโมงของคู่เงิน GBP/USD เมื่อวันพุธที่ผ่านมา ค่าเงินขึ้นมาถึงโซนแนวต้านที่ระดับ 1.3344–1.3357 แล้วเริ่มปรับลงสู่ระดับ 100.0% Fibonacci ที่ 1.3205 จนถึงเช้าวันพฤหัสบดี คู่เงินดังกล่าวซื้อขายอยู่ในช่วงระหว่าง 1.3205 ถึง 1.3344
จากสิ่งที่เห็นในกราฟรายวัน คู่สกุลเงิน Exotic USD/IDR ดูเหมือนจะมีรูปแบบ Bearish 123 ตามด้วยการปรากฏของ Bearish Ross Hook (RH) สองจุด ซึ่งบ่งชี้ว่าสกุลเงินดอลลาร์สหรัฐเริ่มอ่อนค่าลงเมื่อเทียบกับสกุลเงิน Garuda
เมื่อเราพิจารณากราฟ 4 ชั่วโมงของดัชนี Nasdaq 100 ซึ่งกำลังเคลื่อนที่เหนือ WMA (21) ที่มีแนวโน้มสูงขึ้น แสดงให้เห็นว่าขณะนี้ฝั่งผู้ซื้อยังคงมีความได้เปรียบอย่างมาก ดังนั้นในอนาคตอันใกล้นี้ #NDX มีโอกาสที่จะเสริมความแข็งแกร่งต่อไปที่ระดับ 21338.7 หากสามารถทำลายระดับนี้และปิดตัวสูงกว่าได้สำเร็จ
เงินปอนด์อังกฤษประสบปัญหาในการทะลุผ่านแนวต้านที่ระดับ 1.3311 เมื่อปิดตลาดรายวัน ในบริบทปัจจุบัน ระดับนี้สอดคล้องกับเส้นศูนย์ (กลาง) ของตัวชี้วัด Marlin ในกรอบรายวัน น่าสนใจที่สายสัญญาณของออสซิลเลเตอร์ได้สร้างรูปแบบกราฟ "หัวและไหล่กลับหัว" (เน้นโดยสี่เหลี่ยมสีเทา) ด้วยเหตุนี้ เราคาดว่าจะเกิดการทะลุผ่านระดับ 1.3311
เมื่อสิ้นสุดการซื้อขายของเมื่อวาน คู่สกุลเงิน USD/JPY ลดลง 73 pips ทดสอบเส้นอินดิเคเตอร์ MACD ด้วยเงาล่าง เป็นที่ชัดเจนว่ามีความพยายามที่จะสร้างฐานในช่วง 145.08–145.91 แต่ความพยายามยังเร็วเกินไปเนื่องจากมีเส้น MACD อยู่ในช่วงนี้ ภายในประมาณ
ในช่วงต้นของการซื้อขายในตลาดอเมริกา คู่สกุลเงิน EUR/USD กำลังซื้อขายอยู่ราว ๆ ระดับ 1.1203 โดยมีการถอยกลับหลังจากที่ช่องว่างรอบ ๆ 1.1265 ถูกเติมเต็มแล้ว หลังจากมีการรวมตัวเหนือเส้นค่าเฉลี่ยเคลื่อนที่ 21 วัน ยูโรได้ทำการดันขึ้นอย่างแข็งแกร่ง
ในช่วงเช้าของตลาดอเมริกา ราคาของ XAU/USD กำลังซื้อขายอยู่ราวๆ 3,180 ซึ่งดีดตัวขึ้นหลังจากที่ถึงระดับ 3,175 ที่สอดคล้องกับระดับแนวรับรายวันที่ 3 (S_3) คาดว่าจะมีการดีดตัวทางเทคนิคในอีกไม่กี่ชั่วโมงข้างหน้า เพื่อไปถึงยอดของช่องแนวโน้มขาลง จากมุมมองทางเทคนิค ทองคำพยายามที่จะทะลุออกจากช่องแนวโน้มขาลงในช่วงตลาดยุโรป แต่ล้มเหลว
ราคาน้ำมันดิบสหรัฐฯ West Texas Intermediate (WTI) มีการรวมตัวใกล้จุดสูงสุดของเดือน หยุดการเพิ่มต่อเนื่องสี่วัน แต่อย่างไรก็ตาม การปรับตัวลงในวันซื้อขายไม่เป็นไปในทางขาลงอย่างชัดเจน ราคาของ WTI รวมตัวอยู่ใกล้จุดสูงสุดของเดือน โดยมีการหยุดการเพิ่มขึ้นต่อเนื่องสี่วัน ถึงกระนั้น การปรับตัวลงระหว่างวันไม่แสดงถึงความเชื่อมั่นที่จะไปทางขาลงอย่างชัดเจน
ตัวเลขในInstaForex

Your IP address shows that you are currently located in the USA. If you are a resident of the United States, you are prohibited from using the services of InstaFintech Group including online trading, online transfers, deposit/withdrawal of funds, etc.
If you think you are seeing this message by mistake and your location is not the US, kindly proceed to the website. Otherwise, you must leave the website in order to comply with government restrictions.
Why does your IP address show your location as the USA?
Please confirm whether you are a US resident or not by clicking the relevant button below. If you choose the wrong option, being a US resident, you will not be able to open an account with InstaTrade anyway.
We are sorry for any inconvenience caused by this message.

