อ่านรายละเอียดเพิ่มเติม


 02.10.2023 10:49 AM
GBP/USD
Brief Analysis:
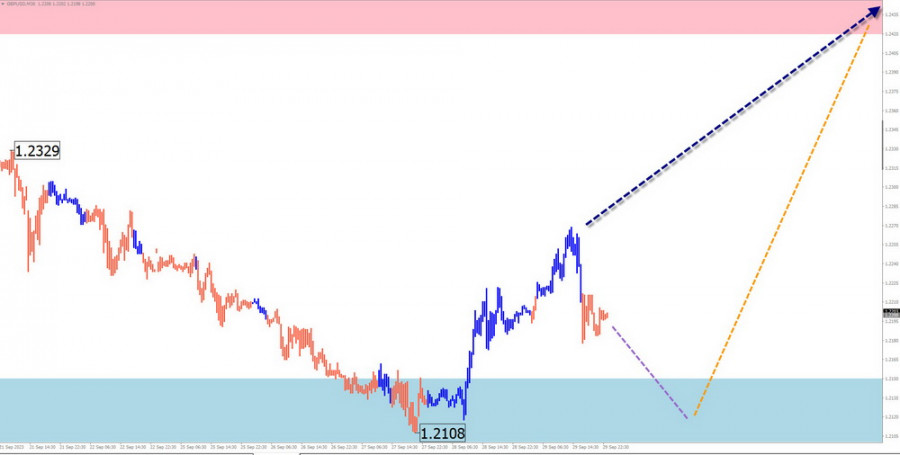
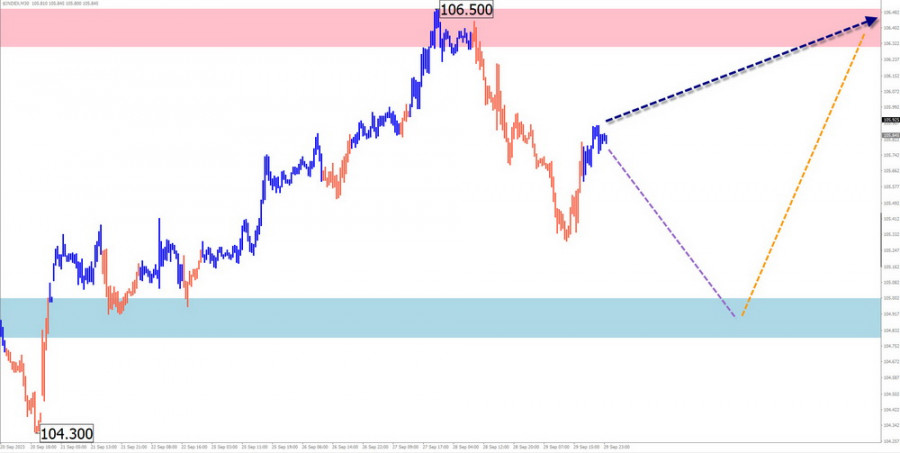
The major of the British pound has been pushing the pair's quotes down on the price chart since mid-July. The price has reached the upper boundary of a potentially reversal zone. Last week, a corrective phase began to form on the chart, which has not yet been completed.
Weekly Forecast:
At the beginning of the upcoming week, there is likely to be a repeat decline in the price of the British currency to the calculated support levels. Afterwards, we can expect a reversal to form. By the end of the week, we can anticipate the beginning of an upward price movement. The resistance zone represents the maximum expected upper boundary of the weekly range for the pair.
Potential Reversal Zones
Resistance:
Support:
Recommendations
Selling: Can be used within individual sessions with a reduced lot size. The downside potential is limited by the support zone.
Buying: Will become relevant after the appearance of corresponding signals from your trading systems in the support zone.
AUD/USD
Brief Analysis:
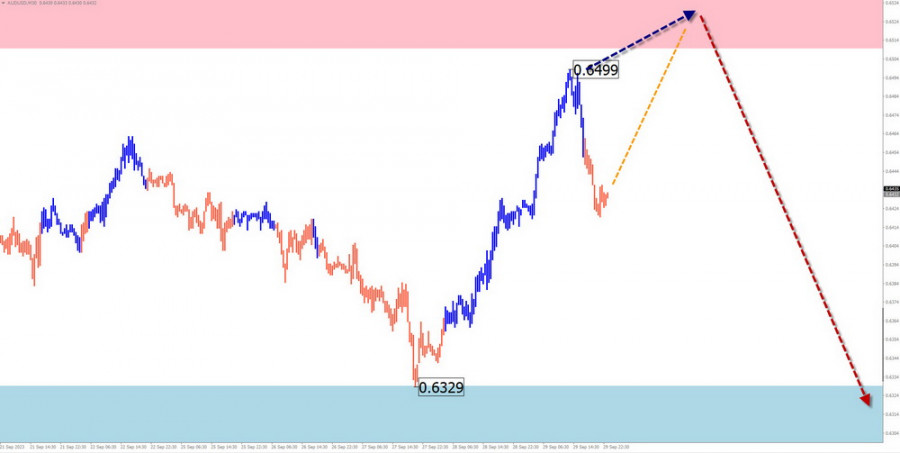
A descending trend dominates the market for the major Australian dollar pair. The count has been underway since July 14th. The price has closely approached the upper boundary of a potentially reversal zone over a large time frame. Over the past two months, the price has formed a correction along this boundary in the form of a stretched flat. The structure of the entire wave is nearing completion.
Weekly Forecast:
In the upcoming week, we expect the continuation of the Aussie's price movement within the corridor between the nearest zones of opposing directions. After potential pressure on the resistance zone at the beginning of the week, we can expect a reversal and a price rollback to the support zone. When the direction changes, a brief breach of the upper boundary of the zone is not excluded.
Potential Reversal Zones
Resistance:
Support:
Recommendations
Selling: Will be possible after the appearance of confirmed signals in the support zone.
Buying: Can be used with a reduced lot size within intraday trading. The resistance places a limit on the potential.
USD/CHF
Brief Analysis:
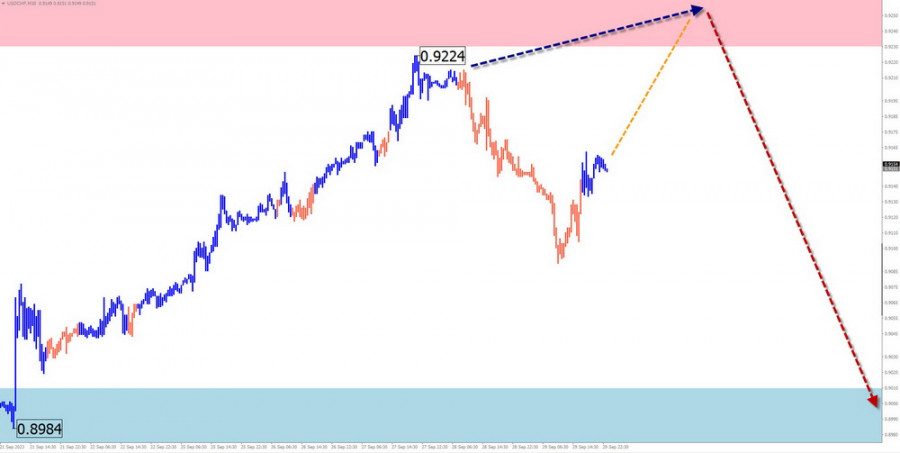
On the chart of the major Swiss franc pair, the ascending wave that started in mid-July continues to dominate. The quotes have come close to the lower boundary of a powerful reversal zone on a monthly scale chart. However, the wave structure does not indicate completion. There are no signals of an imminent change in course as of yet.
Weekly Forecast:
After a likely attempt to exert pressure on the resistance zone in the coming days, the pair's price is expected to move mainly sideways. With a high probability, we can then expect a reversal and the beginning of a price decline. When the course changes, a brief breach of the upper boundary of the resistance zone is not excluded.
Potential Reversal Zones
Resistance:
Support:
Recommendations
Buying: Due to the limited potential, there is a high probability of deposit loss.
Selling: Fractional lots can be used after the appearance of corresponding signals from your trading systems in the resistance zone.
EUR/JPY
Brief Analysis:
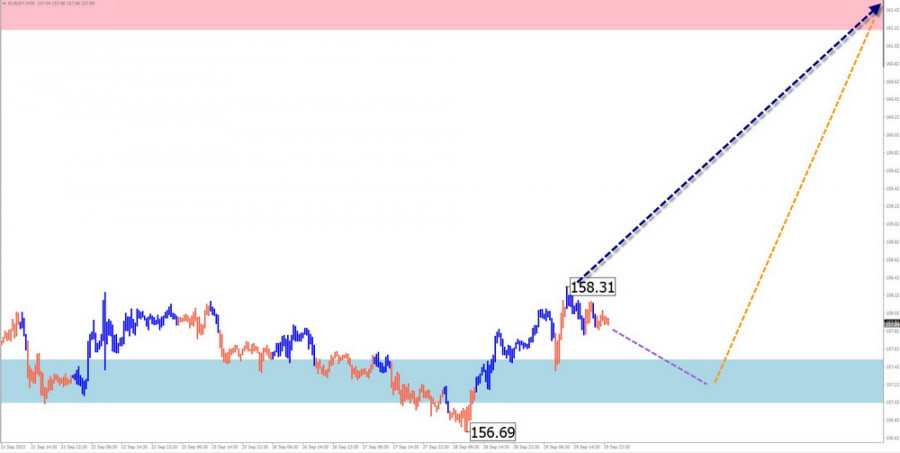
As of the analysis moment, the ascending wave pattern for the euro/yen chart started on July 28th. Over the past month and a half, a flat correction has been developing within it on a horizontal plane. The wave is not yet complete at the time of analysis. After the full completion of the retracement, the bullish trend of the pair will continue.
Weekly Forecast:
At the beginning of the upcoming week, the pair's price is expected to move sideways along the boundaries of the support zone. By the end of the week, a reversal and the resumption of the price ascent can be expected.
Potential Reversal Zones
Resistance:
Support:
Recommendations
Selling: Possible within intraday trading with fractional lots. The potential for trade is limited by support.
Buying: After the appearance of confirmed reversal signals in the support zone, they may be recommended as the main direction for trading.
USDollar Index
Brief Analysis:
The short-term bullish trend of the US dollar, which started in mid-July, continues. The quotes have reached the lower boundary of a potentially reversal zone on the daily time frame. The wave structure does not indicate completion. At the end of the last week, a descending segment began to form.
Weekly Forecast:
In the first half of the upcoming week, a general sideways movement of the index is most likely. A downward vector is possible, with a decrease not below the support zone area. Afterward, the dollar's rate is expected to resume its ascent.
Potential Reversal Zones
Resistance:
Support:
Recommendations
Placing bets on the dollar's continued growth in the near future is risky and may lead to deposit losses. The optimal tactic will be to refrain from trading in major pairs until signals of the dollar's rate increase appear.
Notes: In simplified wave analysis (SWA), all waves consist of three parts (A, B, and C). In each time frame, the latest, unfinished wave is analyzed. Dashed lines indicate expected movements.
Attention: The wave algorithm does not take into account the duration of instrument movements in time!
You have already liked this post today
*บทวิเคราะห์ในตลาดที่มีการโพสต์ตรงนี้ เพียงเพื่อทำให้คุณทราบถึงข้อมูล ไม่ได้เป็นการเจาะจงถึงขั้นตอนให้คุณทำการซื้อขายตาม
โครงสร้างของคลื่นในกราฟ 4 ชั่วโมงสำหรับคู่เงิน EUR/USD ได้เปลี่ยนเป็นการก่อตัวที่มีแนวโน้มเพิ่มขึ้นอย่างแข็งแกร่งและยังคงรักษารูปแบบนี้ไว้ ผมเชื่อว่าไม่มีข้อสงสัยว่านี่เป็นผลมาจากการเปลี่ยนแปลงนโยบายการค้าของสหรัฐฯ อย่างแน่นอน จนถึงวันที่ 28 กุมภาพันธ์ เมื่อค่าเงินดอลลาร์สหรัฐฯ เริ่มอ่อนค่าลงอย่างมาก โครงสร้างของคลื่นได้บ่งชี้ถึงแนวโน้มขาลงอย่างชัดเจน โดยคลื่นแก้ไขที่
โครงสร้างคลื่นของ GBP/USD ยังคงบ่งบอกถึงการก่อตัวของรูปแบบคลื่นขาขึ้น รูปภาพของคลื่นนี้เกือบจะเหมือนกันกับคลื่นของ EUR/USD จนถึงวันที่ 28 กุมภาพันธ์ เราสังเกตเห็นการก่อตัวของโครงสร้างปรับฐานที่ชัดเจนซึ่งไม่มีข้อสงสัยใด ๆ อย่างไรก็ตาม ความต้องการในเงินดอลลาร์สหรัฐฯ เริ่มลดลงอย่างรวดเร็วในเวลาต่อมา ท้ายที่สุดนำไปสู่การกลับตัวของเทรนด์ คลื่น
สำหรับคู่สกุลเงิน GBP/USD รูปแบบคลื่นยังคงบ่งบอกถึงการก่อตัวของโครงสร้างคลื่นแรงกระตุ้นที่ขึ้นไปด้านบน รูปแบบคลื่นนี้คล้ายคลึงกับคู่สกุลเงิน EUR/USD จนถึงวันที่ 28 กุมภาพันธ์ เราได้เห็นโครงสร้างการแก้ไขที่น่าเชื่อถือที่ไม่มีข้อสงสัยใด ๆ เกิดขึ้น อย่างไรก็ตาม มีการลดลงของความต้องการในเงินดอลลาร์สหรัฐอย่างรวดเร็ว นำไปสู่การกลับทิศทางของแนวโน้มเป็นทิศทางขึ้น คลื่นที่
โครงสร้างคลื่นบนกราฟ EUR/USD แบบ 4 ชั่วโมงได้เปลี่ยนไปเป็นรูปแบบขาขึ้นและยังคงรักษาโครงสร้างนี้อยู่ ฉันเชื่อว่ามีข้อสงสัยน้อยมากว่าการเปลี่ยนแปลงนี้เกิดขึ้นจากนโยบายการค้าของสหรัฐฯ รูปแบบคลื่นในตอนนี้แสดงให้เห็นถึงแนวโน้มขาลงที่ชัดเจนเกิดขึ้นช่วงวันที่ 28 กุมภาพันธ์เมื่อเงินดอลลาร์สหรัฐฯเริ่มลดลงอย่างรวดเร็ว มีการสร้างคลื่นแก้ไขที่ 2 ขึ้นมา อย่างไรก็ตาม การประกาศอัตราภาษีจาก Trump
รูปแบบคลื่นในกราฟ 4 ชั่วโมงของคู่สกุลเงิน EUR/USD ได้เปลี่ยนแปลงเป็นโครงสร้างที่เป็นขาขึ้นและยังคงรักษารูปแบบนี้เอาไว้ ฉันเชื่อว่ามีความสงสัยเล็กน้อยว่าการเปลี่ยนแปลงนี้เกิดขึ้นเนื่องจากนโยบายการค้าใหม่ของสหรัฐฯ เพียงอย่างเดียว จนถึงวันที่ 28 กุมภาพันธ์ เมื่อตอนที่ค่าเงินดอลลาร์สหรัฐเริ่มร่วงลงอย่างรวดเร็ว ทั้งรูปแบบคลื่นทั้งหมดก็ยังคงดูเหมือนแนวโน้มขาลงที่น่าเชื่อถือ โดยมีคลื่นปรับแก้ 2 กำลังก่อตัวขึ้น
รูปแบบคลื่นสำหรับ GBP/USD ยังคงบ่งบอกถึงการก่อตัวของโครงสร้างคลื่นที่มีแรงผลักดันขึ้น รูปแบบคลื่นมีความเหมือนกับการระบายที่เกิดขึ้นกับคู่เงิน EUR/USD จนถึงวันที่ 28 กุมภาพันธ์ เราสังเกตเห็นการก่อตัวของโครงสร้างการแก้ไขที่มีความชัดเจน และไม่มีข้อสงสัยใดๆ อย่างไรก็ตาม หลังจากนั้น ความต้องการสำหรับสกุลเงินดอลลาร์สหรัฐเริ่มลดลงอย่างรวดเร็ว ส่งผลให้เกิดการกลับตัวของแนวโน้มเป็นขาขึ้น คลื่นลูกที่
รูปแบบคลื่นในกราฟ 4 ชั่วโมงสำหรับ EUR/USD ได้เปลี่ยนแปลงไปเป็นโครงสร้างขาขึ้น และยังคงเป็นเช่นนั้นอยู่ ผมเชื่อว่าไม่มีข้อสงสัยเลยว่าการเปลี่ยนแปลงนี้เกิดขึ้นมาโดยเฉพาะเนื่องจากนโยบายการค้าของสหรัฐฯ ใหม่ จนถึงวันที่ 28 กุมภาพันธ์ เมื่อการลดลงของดอลลาร์สหรัฐฯ เริ่มกลับตัว รูปแบบคลื่นดูเหมือนจะเป็นส่วนหนึ่งของเทรนด์ขาลงที่น่าเชื่อถือ โดยมีคลื่นปรับฐานที่
โครงสร้างคลื่นสำหรับคู่ GBP/USD ยังคงบ่งชี้ถึงการพัฒนาของรูปแบบคลื่นที่ก้าวไปในทิศทางขึ้น การเกิดขึ้นของรูปแบบคลื่นนี้คล้ายคลึงกับคู่ EUR/USD จนกระทั่งถึงวันที่ 28 กุมภาพันธ์ เราสังเกตเห็นการเกิดโครงสร้างการปรับตัวที่น่าเชื่อถือ ซึ่งไม่ทิ้งพื้นที่ให้สงสัย อย่างไรก็ตาม ความต้องการเงินดอลล่าร์สหรัฐเริ่มลดลงอย่างรวดเร็วจนกระทั่งเกิดการพลิกผันไปในทางขึ้น คลื่น 2 ของแนวโน้มนี้มีรูปคลื่นเพียงคลื่นเดียว
โครงสร้างคลื่นบนชาร์ต 4 ชั่วโมงสำหรับ EUR/USD ได้เปลี่ยนเป็นรูปแบบขาขึ้นและยังคงรักษารูปแบบนี้ไว้ ฉันเชื่อว่าไม่มีข้อสงสัยว่า การเปลี่ยนแปลงนี้เกิดขึ้นเพียงเพราะนโยบายการค้าของสหรัฐฯ ใหม่เท่านั้น ก่อนวันที่ 28 กุมภาพันธ์ ซึ่งเป็นช่วงที่ค่าเงินดอลลาร์สหรัฐเริ่มลดลงอย่างมาก โครงสร้างคลื่นปรากฏเป็นสองช่วงแนวโน้มขาลงที่น่าเชื่อถือ กำลังมีการสร้างคลื่นที่แก้ไขที่
โครงสร้างคลื่นของ GBP/USD ยังคงแสดงถึงการก่อตัวของรูปแบบคลื่นแรงกระตุ้นขาขึ้น โครงสร้างของคลื่นมีความใกล้เคียงกับของ EUR/USD จนถึงวันที่ 28 กุมภาพันธ์ เราสังเกตเห็นรูปแบบโครงสร้างที่มีความน่าเชื่อถือ โดยไม่มีข้อสงสัยแต่อย่างใด อย่างไรก็ตาม ความต้องการดอลลาร์สหรัฐจากนั้นเริ่มลดลงอย่างรวดเร็ว ส่งผลให้เกิดการกลับตัวของแนวโน้ม คลื่นที่
ตารางของ Forex
เวอร์ชั่นแบบ หน้าเว็บไซต์

Your IP address shows that you are currently located in the USA. If you are a resident of the United States, you are prohibited from using the services of InstaFintech Group including online trading, online transfers, deposit/withdrawal of funds, etc.
If you think you are seeing this message by mistake and your location is not the US, kindly proceed to the website. Otherwise, you must leave the website in order to comply with government restrictions.
Why does your IP address show your location as the USA?
Please confirm whether you are a US resident or not by clicking the relevant button below. If you choose the wrong option, being a US resident, you will not be able to open an account with InstaTrade anyway.
We are sorry for any inconvenience caused by this message.

