อ่านรายละเอียดเพิ่มเติม


 23.12.2024 03:07 PM
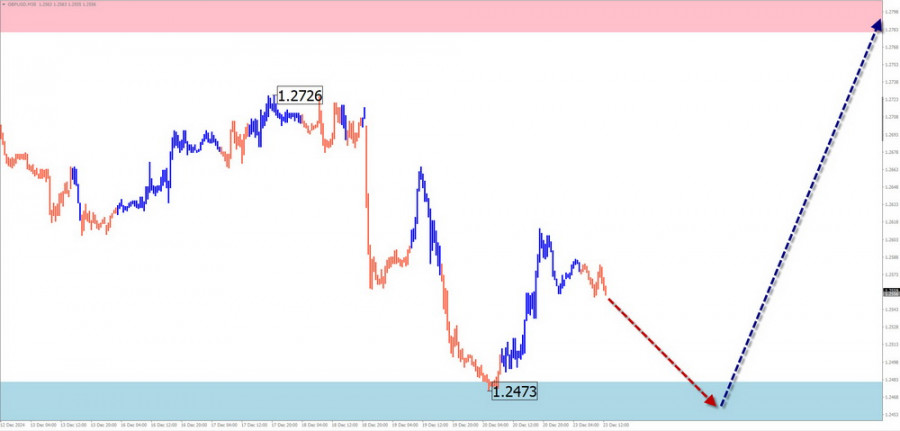
Summary Analysis:The dominant wave for GBP/USD has been upward for the past few years, establishing a new short-term trend. Currently, the price is near the lower boundary of a strong resistance zone, forming a corrective wave (B) since late August. Although the wave structure appears complete, no clear reversal signals are evident on the chart.
Weekly Forecast:For most of the upcoming week, GBP/USD is expected to move within the range between nearby zones. After testing the support zone, a reversal and a change in direction are likely. A breakout above the resistance range within the weekly movement is unlikely.
Potential Reversal Zones:
Recommendations:
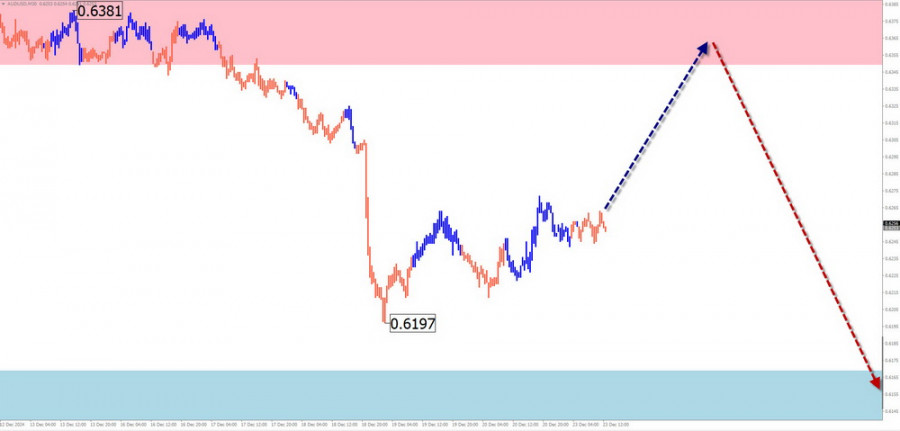
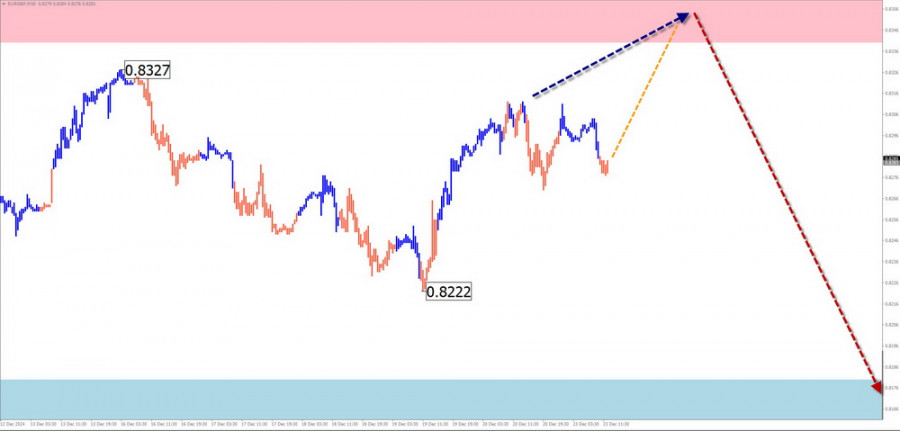
Summary Analysis:A downward wave has been forming for AUD/USD since late September. Last week, the pair developed a stretched corrective flat in a sideways range. The price broke below intermediate support, which has now become resistance. A consolidation above this level is needed before the decline resumes.
Weekly Forecast:At the start of the week, expect a short-term upward rebound, limited by the resistance zone. The bearish trend is likely to resume, pushing the price toward the support range.
Potential Reversal Zones:
Recommendations:
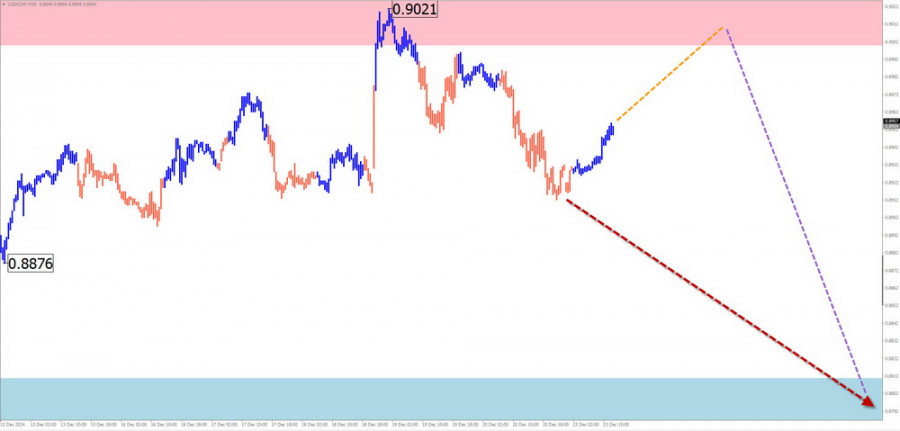
Summary Analysis:The short-term direction of USD/CHF has been upward since August 5. The wave structure appears complete, and the price has reached the preliminary target zone. However, there are no immediate reversal signals on the chart.
Weekly Forecast:Expect sideways movement near the calculated resistance zone early in the week. Toward the weekend, there is a higher probability of increased volatility and a potential price decline. Brief breaches of the resistance boundary cannot be ruled out.
Potential Reversal Zones:
Recommendations:
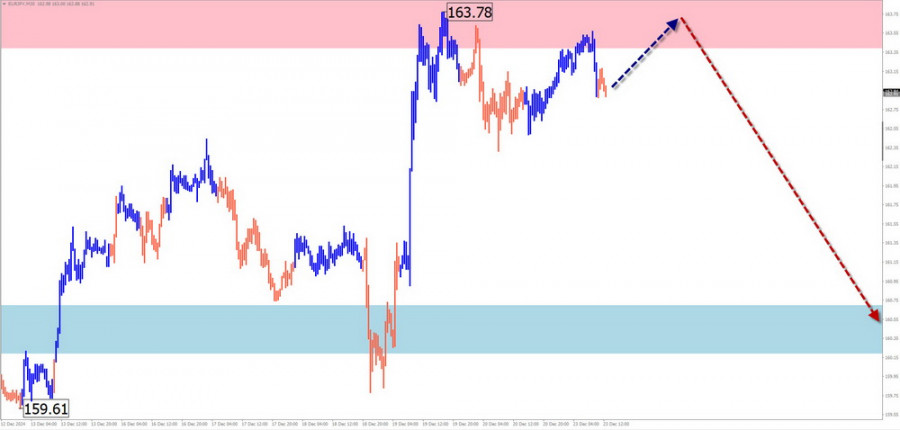
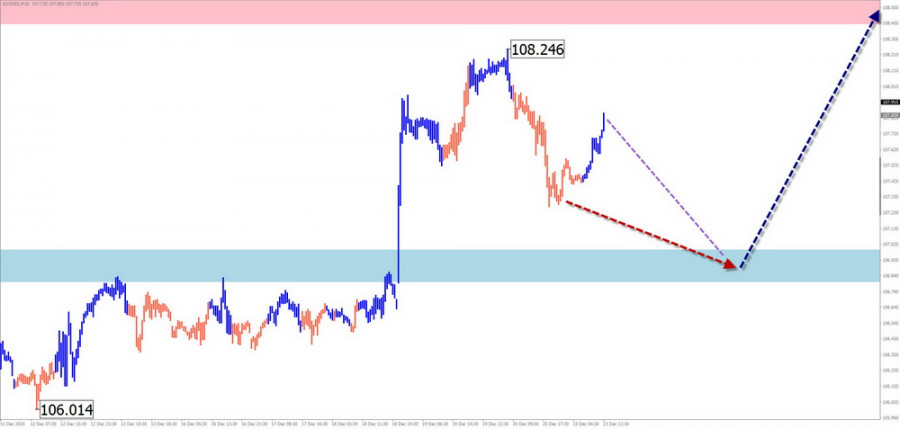
Summary Analysis:The upward wave for EUR/JPY, which began on December 3, remains unfinished. Late last week, the price reached the lower boundary of a strong potential reversal zone on a higher timeframe. Since December 19, a counter-directional wave with reversal potential has started forming.
Weekly Forecast:The price is expected to move from the resistance zone toward the calculated support zone during the week. A breakout beyond these zones is unlikely within the weekly timeframe.
Potential Reversal Zones:
Recommendations:
EUR/GBP
Summary Analysis:The short-term movements of EUR/GBP have been driven by a downward wave since March 19. The final segment (C) is forming a horizontal correction that remains incomplete.
Weekly Forecast:Sideways movement is likely at the beginning of the week, with a potential upward bias. A reversal and renewed downward movement are expected near the resistance zone. The weekly decline will likely be limited by the calculated support zone.
Potential Reversal Zones:
Recommendations:
Summary Analysis:The upward wave for the US Dollar Index, which began in late September, is ongoing. After breaking through strong resistance in mid-December, the price established a base for further growth, though it needs consolidation at current levels.
Weekly Forecast:Expect the index to complete its downward retracement within the first few days of the week. A reversal and resumption of the upward movement are likely in the second half, with gains extending toward the resistance zone.
Potential Reversal Zones:
Recommendations:
You have already liked this post today
*บทวิเคราะห์ในตลาดที่มีการโพสต์ตรงนี้ เพียงเพื่อทำให้คุณทราบถึงข้อมูล ไม่ได้เป็นการเจาะจงถึงขั้นตอนให้คุณทำการซื้อขายตาม
รูปแบบคลื่นของ GBP/USD ก็ได้เปลี่ยนไปเป็นโครงสร้างบูลลิชที่มีแรงขับเคลื่อน — "ขอบคุณ" Donald Trump ภาพคลื่นตอนนี้เหมือนกับ EUR/USD อย่างมาก จนถึงวันที่ 28 กุมภาพันธ์ เราได้เห็นการพัฒนาของโครงสร้างการปรับฐานที่ชัดเจนซึ่งไม่มีความกังวลแต่อย่างใด อย่างไรก็ตาม
โครงสร้างคลื่นบนกราฟ 4 ชั่วโมงของ EUR/USD ได้เปลี่ยนเป็นรูปแบบขาขึ้นและยังคงเป็นเช่นนั้น การเปลี่ยนแปลงนี้ไม่ต้องสงสัยเลยว่าเกิดขึ้นจากนโยบายการค้าใหม่ของสหรัฐฯ อย่างสมบูรณ์ ก่อนวันที่ 28 กุมภาพันธ์ เมื่อการลดลงอย่างรุนแรงของค่าดอลลาร์เริ่มต้นขึ้น โครงสร้างคลื่นทั้งหมดสะท้อนถึงเทรนด์ขาลงที่ชัดเจนซึ่งเป็นคลื่นแก้ไขที่ 2 อย่างไรก็ตาม การประกาศต่างๆ
โครงสร้างของคลื่นในกราฟ EUR/USD แบบ 4 ชั่วโมง ได้เปลี่ยนเป็นรูปแบบขาขึ้น ฉันเชื่อว่าแทบไม่มีข้อสงสัยใด ๆ เลยว่าการเปลี่ยนแปลงนี้เกิดจากนโยบายการค้าฉบับใหม่ของสหรัฐเท่านั้น จนถึงวันที่ 28 กุมภาพันธ์ เมื่อค่าเงินดอลลาร์สหรัฐเริ่มตกลงโครงสร้างคลื่นทั้งหมดชัดเจนว่าเป็นขาลง สิ่งที่กำลังเกิดขึ้นคือคลื่นปรับฐานที่
รูปแบบคลื่นสำหรับเครื่องมือ GBP/USD ก็ได้เปลี่ยนไปสู่โครงสร้างขาขึ้นและเร่งตัวเช่นเดียวกัน—"ขอบคุณ" Donald Trump รูปแบบคลื่นเกือบจะเหมือนกับ EUR/USD จนถึงวันที่ 28 กุมภาพันธ์ เราได้สังเกตเห็นโครงสร้างแก้ไขโทนแต้ไม่มีข้อกังวล อย่างไรก็ตาม ความต้องการเงินดอลลาร์สหรัฐเริ่มลดลงอย่างรวดเร็วตามมา ผลที่ได้คือการสร้างโครงสร้างห้าคลื่นขาขึ้น คลื่นที่
โครงสร้างคลื่นของ GBP/USD ได้เปลี่ยนไปเป็นรูปแบบขาขึ้นที่มีแรงกระตุ้นจาก "ความสำเร็จ" ของ Donald Trump ลักษณะคลื่นใกล้เคียงกับ EUR/USD เป็นอย่างมาก จนถึงวันที่ 28 กุมภาพันธ์ เราได้สังเกตเห็นการก่อตัวของโครงสร้างการแก้ไขที่ชัดเจนและไม่มีปัญหาใด
รูปแบบคลื่นบนกราฟ 4 ชั่วโมงของ EUR/USD ได้เปลี่ยนแปลงมาเป็นโครงสร้างขาขึ้น ผมเชื่อว่าไม่มีข้อสงสัยว่านี่เป็นผลมาจากนโยบายการค้าใหม่ของสหรัฐฯ ก่อนวันที่ 28 กุมภาพันธ์ เมื่อค่าเงินดอลลาร์สหรัฐเริ่มมีการลดค่าอย่างรุนแรง โครงสร้างคลื่นทั้งหมดดูเหมือนเป็นแนวโน้มขาลงที่ชัดเจน ส่วนที่เป็นคลื่นปรับฐาน 2 กำลังถูกสร้างขึ้น อย่างไรก็ตาม
รูปแบบแนวโน้มของ GBP/USD ได้ปรับเปลี่ยนเป็นโครงสร้างขาขึ้นในลักษณะกระตุ้น—"ต้องขอบคุณ" Donald Trump รูปแบบนี้คล้ายคลึงกับ EUR/USD จนถึงวันที่ 28 กุมภาพันธ์ เราเห็นโครงสร้างการแก้ไขที่ดูน่าเชื่อถือ ซึ่งไม่ได้สร้างความกังวล อย่างไรก็ตาม ความต้องการเงินดอลลาร์สหรัฐเริ่มลดลงอย่างรวดเร็ว ส่งผลให้เกิดโครงสร้างขาขึ้นแบบห้าคลื่นขึ้น
รูปแบบคลื่นในกราฟ 4 ชั่วโมงของ EUR/USD ได้เปลี่ยนเป็นโครงสร้างขาขึ้น ผมเชื่อว่าแทบไม่มีข้อสงสัยเลยว่าการเปลี่ยนแปลงนี้เกิดขึ้นโดยสิ้นเชิงเนื่องจากนโยบายการค้าของสหรัฐฯ ที่เปลี่ยนไป จนถึงวันที่ 28 กุมภาพันธ์ ซึ่งเป็นช่วงที่ค่าเงินดอลลาร์สหรัฐเริ่มตกต่ำลงอย่างรุนแรง โครงสร้างคลื่นทั้งหมดดูเหมือนเป็นช่วงแนวโน้มขาลงที่น่าเชื่อถือ โดยมีคลื่นแก้ไขที่ 2 กำลังเกิดขึ้น
โครงสร้างการเคลื่อนที่ของคู่เงิน GBP/USD ก็ได้เปลี่ยนมาเป็นโครงสร้างลักษณะขาขึ้นตามแบบ impulse ด้วยความ "ขอบคุณ" จาก Donald Trump ภาพคลื่นแทบจะเหมือนกับของ EUR/USD ก่อนวันที่ 28 กุมภาพันธ์ เราได้สังเกตเห็นโครงสร้างการแก้ไขที่น่าเชื่อถือซึ่งไม่ได้ก่อให้เกิดความกังวลใหญ่ใด
วิเคราะห์กราฟ EUR/USD รูปแบบคลื่นบนกราฟ EUR/USD ช่วง 4 ชั่วโมง ได้เปลี่ยนเป็นโครงสร้างที่มีแนวโน้มขาขึ้น ผมเชื่อว่าไม่มีข้อสงสัยเลยว่าการเปลี่ยนแปลงนี้เกิดขึ้นเนื่องจากนโยบายการค้าใหม่ที่ใช้โดยสหรัฐอเมริกาเพียงอย่างเดียว จนถึงวันที่ 28 กุมภาพันธ์—เมื่อการลดลงอย่างมากของสกุลเงินดอลลาร์สหรัฐฯ เริ่มขึ้น—รูปแบบคลื่นได้นำเสนอแนวโน้มขาลงที่น่าเชื่อถือ สร้างคลื่นแก้ไข
สมาชิกInstaForex

Your IP address shows that you are currently located in the USA. If you are a resident of the United States, you are prohibited from using the services of InstaFintech Group including online trading, online transfers, deposit/withdrawal of funds, etc.
If you think you are seeing this message by mistake and your location is not the US, kindly proceed to the website. Otherwise, you must leave the website in order to comply with government restrictions.
Why does your IP address show your location as the USA?
Please confirm whether you are a US resident or not by clicking the relevant button below. If you choose the wrong option, being a US resident, you will not be able to open an account with InstaTrade anyway.
We are sorry for any inconvenience caused by this message.

