Dolzarb patternlar

Актуальные паттерны
- Все
- Все
- Bearish Rectangle
- Bearish Symmetrical Triangle
- Bearish Symmetrical Triangle
- Bullish Rectangle
- Double Top
- Double Top
- Triple Bottom
- Triple Bottom
- Triple Top
- Triple Top
- Все
- Все
- Покупка
- Продажа
- Все
- 1
- 2
- 3
- 4
- 5
Double Top
сформирован 17.04 в 19:20:46 (UTC+0)
сила сигнала 1 из 5
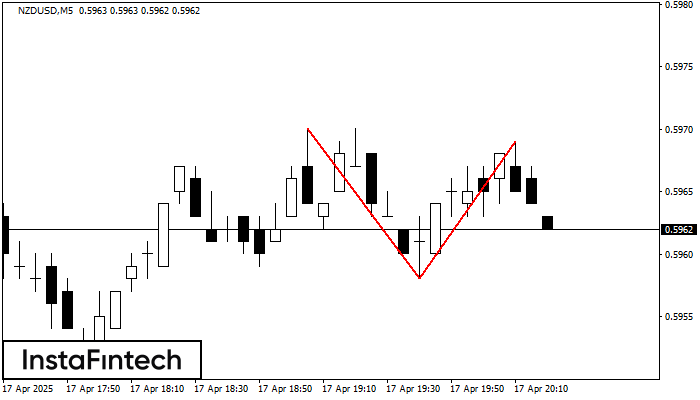
The Double Top reversal pattern has been formed on NZDUSD M5. Characteristics: the upper boundary 0.5970; the lower boundary 0.5958; the width of the pattern is 11 points. Sell trades
The M5 and M15 time frames may have more false entry points.
Открыть график инструмента в новом окне
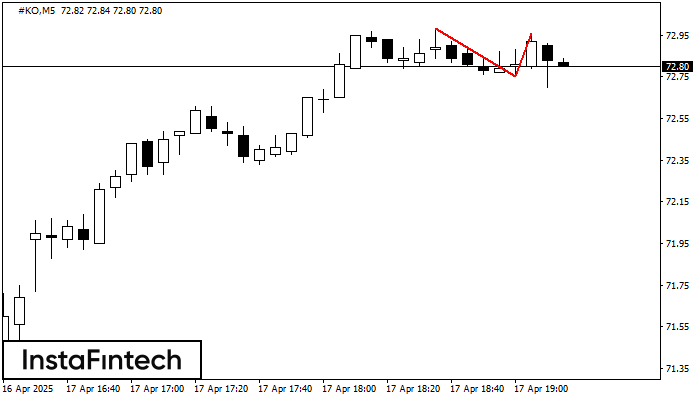
Double Top
сформирован 17.04 в 19:15:19 (UTC+0)
сила сигнала 1 из 5
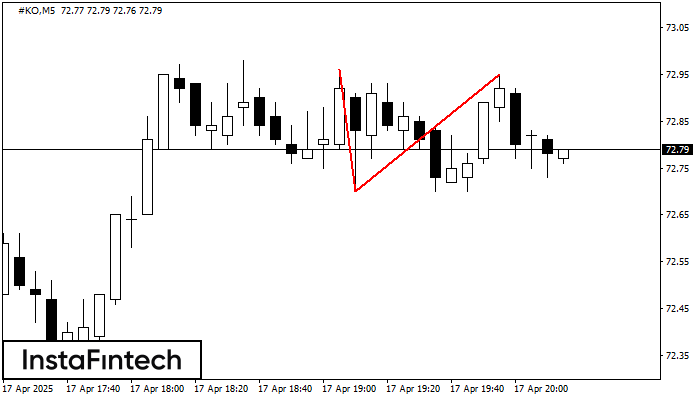
On the chart of #KO M5 the Double Top reversal pattern has been formed. Characteristics: the upper boundary 72.95; the lower boundary 72.70; the width of the pattern 25 points
The M5 and M15 time frames may have more false entry points.
Открыть график инструмента в новом окне
Head and Shoulders
сформирован 17.04 в 18:45:16 (UTC+0)
сила сигнала 2 из 5
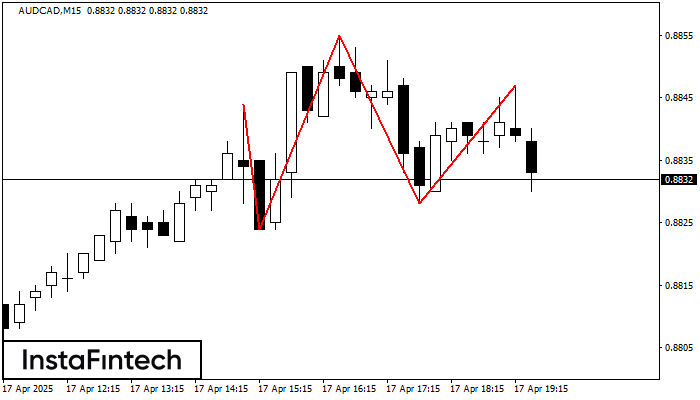
The AUDCAD M15 formed the Head and Shoulders pattern with the following features: The Head’s top is at 0.8855, the Neckline and the upward angle are at 0.8824/0.8828. The formation
The M5 and M15 time frames may have more false entry points.
Открыть график инструмента в новом окне
Triple Top
сформирован 17.04 в 18:45:16 (UTC+0)
сила сигнала 1 из 5
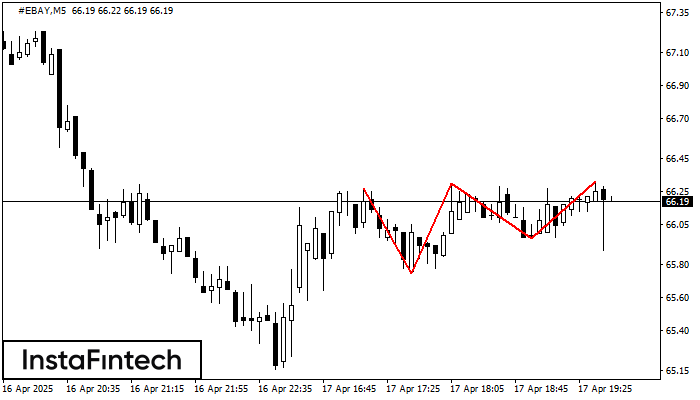
The Triple Top pattern has formed on the chart of the #EBAY M5. Features of the pattern: borders have an ascending angle; the lower line of the pattern
The M5 and M15 time frames may have more false entry points.
Открыть график инструмента в новом окне
Double Bottom
сформирован 17.04 в 18:45:14 (UTC+0)
сила сигнала 2 из 5
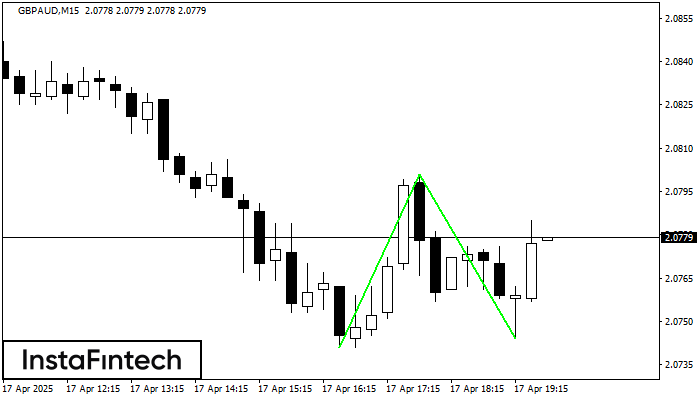
The Double Bottom pattern has been formed on GBPAUD M15; the upper boundary is 2.0801; the lower boundary is 2.0744. The width of the pattern is 60 points. In case
The M5 and M15 time frames may have more false entry points.
Открыть график инструмента в новом окне
Bearish Flag
сформирован 17.04 в 18:36:16 (UTC+0)
сила сигнала 5 из 5
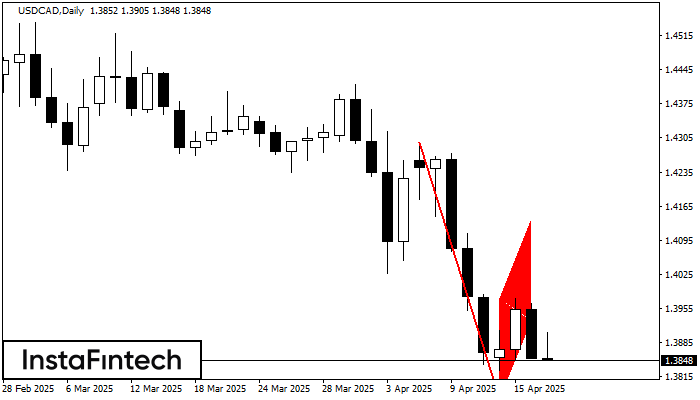
The Bearish Flag pattern has been formed on the chart USDCAD D1 which signals that the downward trend will continue. If the price breaks below the low at 1.3767, then
Открыть график инструмента в новом окне
Bearish pennant
сформирован 17.04 в 18:36:12 (UTC+0)
сила сигнала 5 из 5
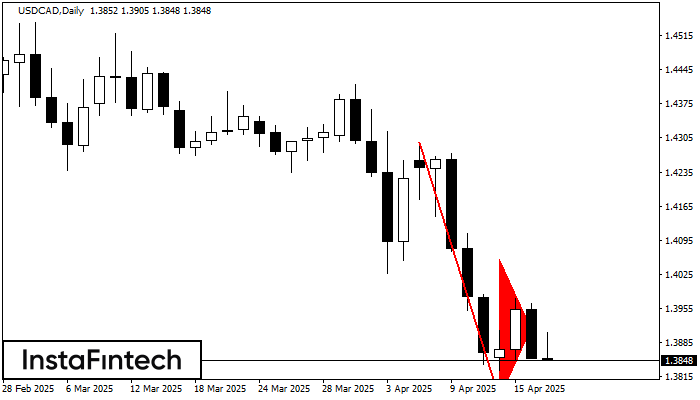
The Bearish pennant pattern has formed on the USDCAD D1 chart. It signals potential continuation of the existing trend. Specifications: the pattern’s bottom has the coordinate of 1.3767; the projection
Открыть график инструмента в новом окне
Double Top
сформирован 17.04 в 18:15:13 (UTC+0)
сила сигнала 1 из 5
On the chart of #KO M5 the Double Top reversal pattern has been formed. Characteristics: the upper boundary 72.96; the lower boundary 72.75; the width of the pattern 21 points
The M5 and M15 time frames may have more false entry points.
Открыть график инструмента в новом окне
Double Bottom
сформирован 17.04 в 18:00:01 (UTC+0)
сила сигнала 1 из 5
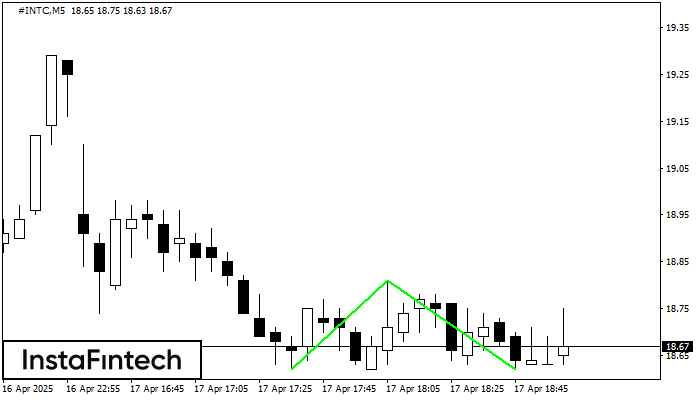
The Double Bottom pattern has been formed on #INTC M5; the upper boundary is 18.81; the lower boundary is 18.62. The width of the pattern is 19 points. In case
The M5 and M15 time frames may have more false entry points.
Открыть график инструмента в новом окне