Dolzarb patternlar

Двойная вершина
сформирован 07.04 в 23:55:06 (UTC+0)
сила сигнала 1 из 5
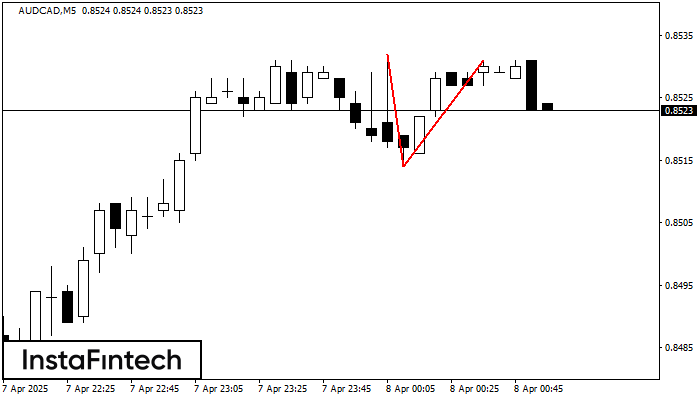
По AUDCAD на M5 сформировалась разворотная фигура «Двойная вершина». Характеристика: Верхняя граница 0.8532; Нижняя граница 0.8514; Ширина фигуры 17 пунктов. Позицию на продажу возможно открыть ниже нижней границы 0.8514, с перспективой хода к уровню 0.8499.
Таймфреймы М5 и М15 могут иметь больше ложных точек входа.
- Все
- Все
- Bearish Rectangle
- Bearish Symmetrical Triangle
- Bearish Symmetrical Triangle
- Bullish Rectangle
- Double Top
- Double Top
- Triple Bottom
- Triple Bottom
- Triple Top
- Triple Top
- Все
- Все
- Покупка
- Продажа
- Все
- 1
- 2
- 3
- 4
- 5
Bearish Symmetrical Triangle
was formed on 01.05 at 20:55:45 (UTC+0)
signal strength 1 of 5
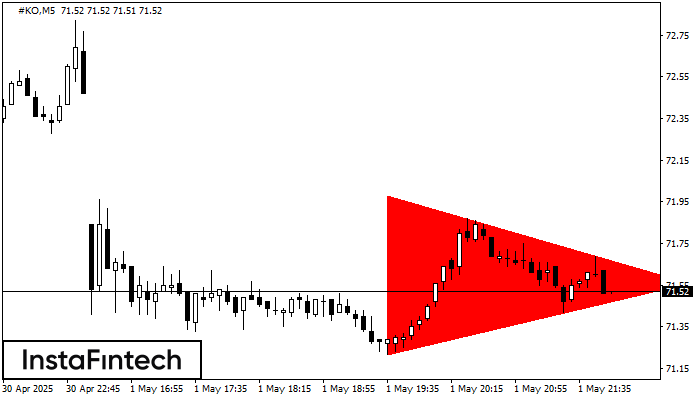
According to the chart of M5, #KO formed the Bearish Symmetrical Triangle pattern. This pattern signals a further downward trend in case the lower border 71.22 is breached. Here
The M5 and M15 time frames may have more false entry points.
Open chart in a new window
Double Bottom
was formed on 01.05 at 20:45:19 (UTC+0)
signal strength 2 of 5
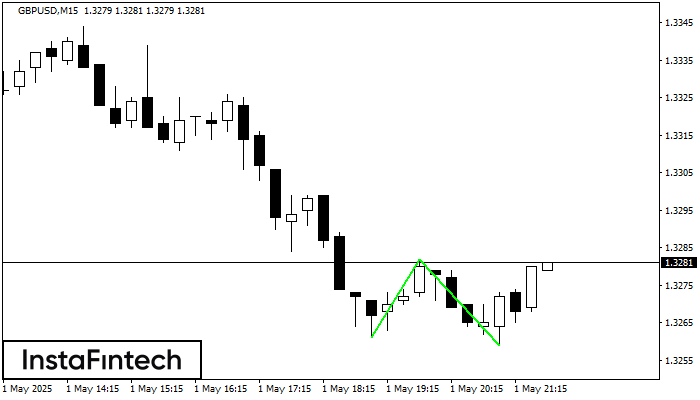
The Double Bottom pattern has been formed on GBPUSD M15; the upper boundary is 1.3282; the lower boundary is 1.3259. The width of the pattern is 21 points. In case
The M5 and M15 time frames may have more false entry points.
Open chart in a new window
Double Top
was formed on 01.05 at 20:30:19 (UTC+0)
signal strength 1 of 5
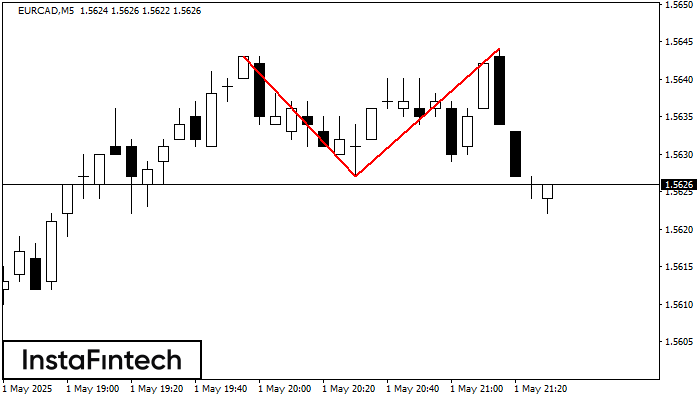
On the chart of EURCAD M5 the Double Top reversal pattern has been formed. Characteristics: the upper boundary 1.5644; the lower boundary 1.5627; the width of the pattern 17 points
The M5 and M15 time frames may have more false entry points.
Open chart in a new window