Dolzarb patternlar

Двойная вершина
сформирован 18.04 в 10:55:17 (UTC+0)
сила сигнала 1 из 5
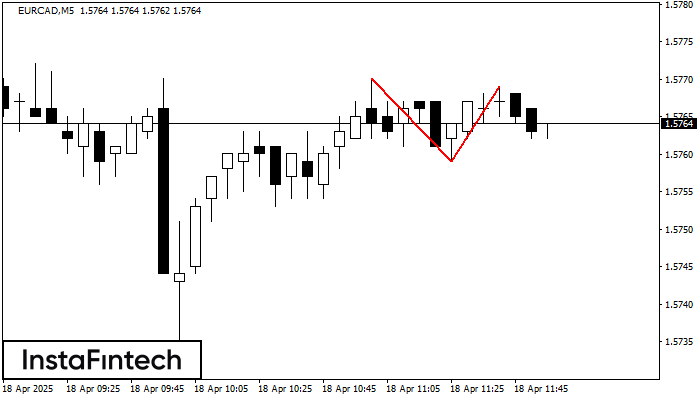
На торговом графике EURCAD M5 сформировалась разворотная фигура «Двойная вершина». Характеристика: Верхняя граница 1.5769; Нижняя граница 1.5759; Ширина фигуры 10 пунктов. Сигнал: Пробой нижней границы 1.5759 приведет к дальнейшему нисходящему движению с перспективой хода к уровню 1.5744.
Таймфреймы М5 и М15 могут иметь больше ложных точек входа.
- Все
- Все
- Bearish Rectangle
- Bearish Symmetrical Triangle
- Bearish Symmetrical Triangle
- Bullish Rectangle
- Double Top
- Double Top
- Triple Bottom
- Triple Bottom
- Triple Top
- Triple Top
- Все
- Все
- Покупка
- Продажа
- Все
- 1
- 2
- 3
- 4
- 5
Double Top
сформирован 11.06 в 10:15:23 (UTC+0)
сила сигнала 1 из 5
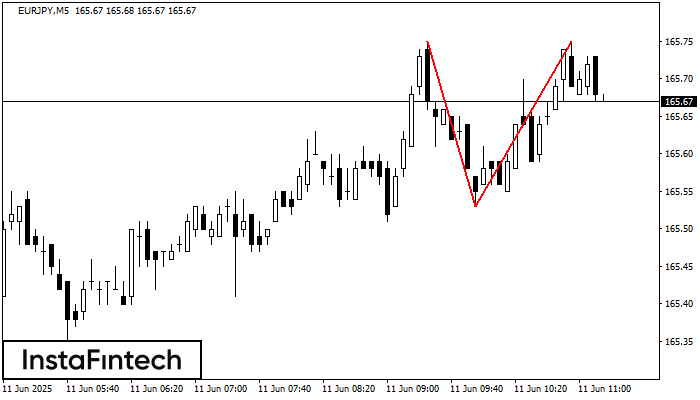
The Double Top pattern has been formed on EURJPY M5. It signals that the trend has been changed from upwards to downwards. Probably, if the base of the pattern 165.53
The M5 and M15 time frames may have more false entry points.
Открыть график инструмента в новом окне
Double Bottom
сформирован 11.06 в 10:00:21 (UTC+0)
сила сигнала 3 из 5
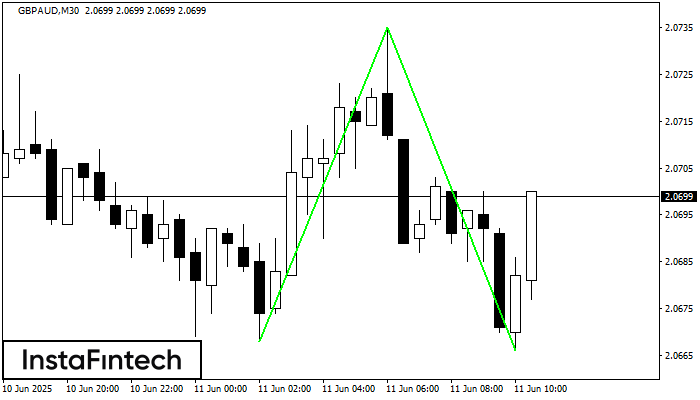
The Double Bottom pattern has been formed on GBPAUD M30; the upper boundary is 2.0735; the lower boundary is 2.0666. The width of the pattern is 67 points. In case
Открыть график инструмента в новом окне
Bullish Symmetrical Triangle
сформирован 11.06 в 09:49:51 (UTC+0)
сила сигнала 2 из 5
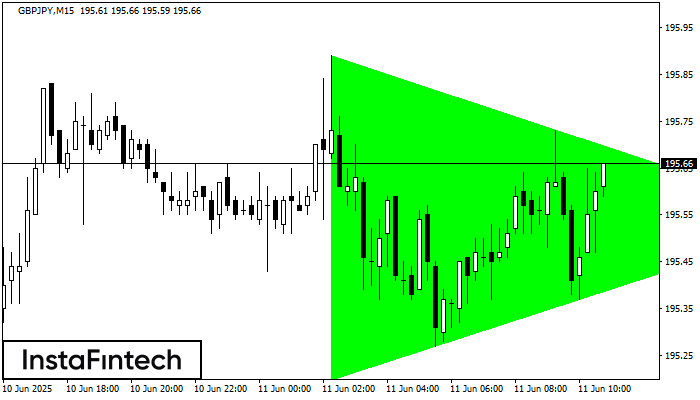
According to the chart of M15, GBPJPY formed the Bullish Symmetrical Triangle pattern, which signals the trend will continue. Description. The upper border of the pattern touches the coordinates 195.89/195.54
The M5 and M15 time frames may have more false entry points.
Открыть график инструмента в новом окне