empty
30.03.2023 03:40 PM
Trading Signal for GOLD (XAU/USD) for March 30 - 31, 2023: buy above $1,963 or sell if breaks $1,955 (21 SMA - 61.8% Fibonacci)

This image is no longer relevant

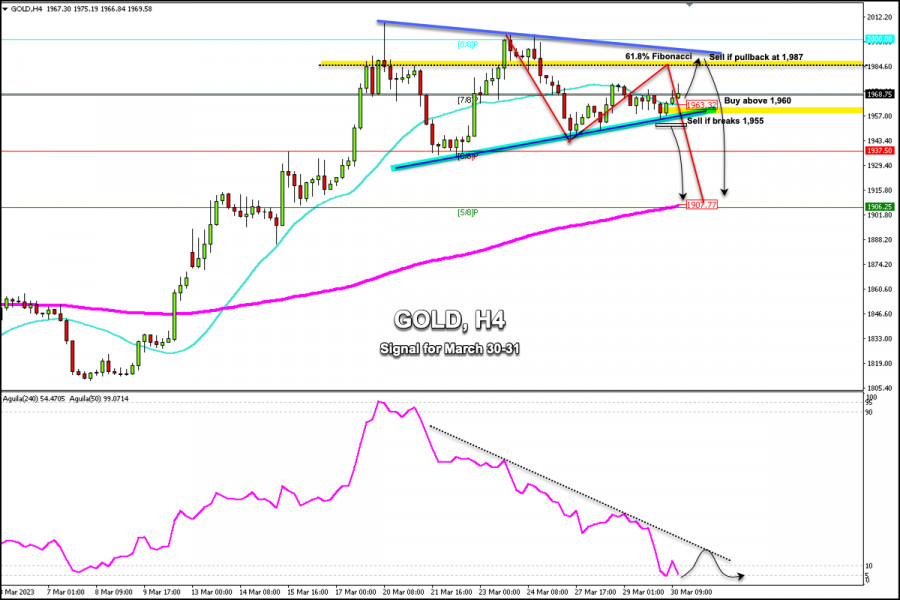
Early in the American session, Gold (XAU/USD) is trading around 1,968 above 7/8 Murray and above the 21 SMA located at 1,963.32.

According to the 4-hour chart, we can see that gold is making a technical rebound after falling from the high of 2,003.21 to the low of 1,943.86.

This movement could mean a correction towards the 61.8% Fibonacci, located around 1,984. A pullback towards this area could be a sign for gold to resume its bearish cycle and it could reach the 200 EMA located at 1,907 in the next few days.

XAU/USD is currently trading above the 21 SMA located at 1,963 which favors a bullish movement. If it consolidates above this level, it could continue to rise until it reaches 1,975 and 1,987.

A pullback to the resistance zone of the downtrend channel formed between the high of 2009 and 2003 could be a point to sell around 1,987, with targets at 1,950 and 1,907 (200 EMA).

For gold to resume its bullish cycle, we should expect a sharp break above 1,990 and consolidation above 8/8 Murray (2000). Then, the metal could reach +1/8 Murray located at 2,031.25.

Conversely, for gold to turn more bearish, it will need to break the bottom of the uptrend channel formed between the low of 1,934 and 1,943. Then, it could reach 1,937 (6/8 Murray) and 1,907 (200 EMA).

The Eagle indicator has reached the extremely oversold zone around 5 points which is likely to be followed by any technical bounce. As long as it does not break its pressure line, it could be a signal to sell.

Recommended Stories

Tín hiệu giao dịch cho EUR/USD từ ngày 16-19 tháng 5, 2025: bán dưới mức 1.1230 (200 EMA - 6/8 Murray)

Vào đầu phiên giao dịch Mỹ, cặp EUR/USD đang giao dịch quanh mức 1.1178, dưới 200 EMA và dưới 21 SMA với áp lực giảm giá. Khi chạm

Dimitrios Zappas 17:04 2025-05-16 UTC+2

Tín hiệu giao dịch cho VÀNG từ ngày 16-19 tháng 5, 2025: bán dưới $3,211 -3,226 (200 EMA - 21 SMA)

Chỉ báo Eagle đang tiến đến mức quá bán, vì vậy chúng tôi tin rằng bất kỳ sự hồi lại nào, miễn là giá vàng duy trì trên mức 4/8

Dimitrios Zappas 17:02 2025-05-16 UTC+2

USD/CAD. Phân tích và Dự báo

Tính đến thứ Sáu, cặp tiền USD/CAD đang chịu áp lực trong ngày thứ hai liên tiếp, do một loạt các yếu tố tiêu cực. Dữ liệu kinh

Irina Yanina 11:28 2025-05-16 UTC+2

Dự báo Forex 16/05/2025: EUR/USD, USD/JPY, USD/CAD, Vàng, Dầu và Bitcoin

Các liên kết hữu ích: Các bài viết khác của tôi có sẵn trong phần này Khóa học cho người mới bắt đầu của InstaForex Phân Tích Phổ Biến

Sebastian Seliga 11:08 2025-05-16 UTC+2

Chỉ số Đô la Mỹ (DXY). Phân tích và Dự báo

Chỉ số Đô la Mỹ, theo dõi hiệu suất của đồng đô la Mỹ so với một rổ các đồng tiền chính, tiếp tục giao dịch với xu hướng tiêu

Irina Yanina 10:56 2025-05-16 UTC+2

EUR/USD. Ngày 16 tháng 5. Con Đường Thách Thức Cho Đồng Đô La

Vào thứ Năm, cặp tỷ giá EUR/USD hai lần giảm xuống mức Fibonacci 127.2% tại 1.1181 và đều bật lên, cho thấy một sự đảo chiều có lợi cho đồng

Samir Klishi 10:21 2025-05-16 UTC+2

Dự báo cho GBP/USD vào ngày 16 tháng 5, 2025

Không có dấu hiệu rõ ràng nào từ thị trường mà nhà đầu tư có thể dễ dàng nhận ra. Gấu đã tiến lên—để rồi ngay

Samir Klishi 10:13 2025-05-16 UTC+2

Dự báo tỷ giá EUR/USD cho ngày 16 tháng 5 năm 2025

Trong thị trường yên tĩnh ngày hôm qua, mặc dù đã có sự phát hành của nhiều dữ liệu kinh tế từ Châu Âu và Mỹ, đồng euro vẫn tăng

Laurie Bailey 05:21 2025-05-16 UTC+2

Dự báo tỷ giá GBP/USD cho ngày 16 tháng 5 năm 2025

Vào thứ Năm, Vương quốc Anh đã công bố dữ liệu GDP mạnh mẽ nhưng không gây ra hoạt động đáng chú ý nào trên thị trường ngoại

Laurie Bailey 05:21 2025-05-16 UTC+2

Dự báo tỷ giá USD/JPY ngày 16 tháng 5, 2025

Thứ Sáu có thể đánh dấu ngày thứ tư liên tiếp của một nến giảm giá (đen) hàng ngày. Lần cuối cùng mô hình này xảy ra là từ ngày

Laurie Bailey 05:07 2025-05-16 UTC+2
Không thể nói chuyện ngay bây giờ?
Đặt câu hỏi của bạn trong phần trò chuyện.
 

Dear visitor,

Your IP address shows that you are currently located in the USA. If you are a resident of the United States, you are prohibited from using the services of InstaFintech Group including online trading, online transfers, deposit/withdrawal of funds, etc.

If you think you are seeing this message by mistake and your location is not the US, kindly proceed to the website. Otherwise, you must leave the website in order to comply with government restrictions.

Why does your IP address show your location as the USA?

  • - you are using a VPN provided by a hosting company based in the United States;
  • - your IP does not have proper WHOIS records;
  • - an error occurred in the WHOIS geolocation database.

Please confirm whether you are a US resident or not by clicking the relevant button below. If you choose the wrong option, being a US resident, you will not be able to open an account with InstaTrade anyway.

We are sorry for any inconvenience caused by this message.