

Các mẫu thực tế

Các mẫu là các mô hình đồ họa được hình thành trong biểu đồ theo giá. Theo một trong những định đề phân tích kỹ thuật, lịch sử (chuyển động giá) thường tự lặp lại. Có nghĩa là biến động giá thường giống nhau trong các tình huống giống nhau, do đó có thể dự đoán chuyển động tiếp theo của tình huống với xác suất cao.
Các mẫu hữu quan của InstaTrade là một dịch vụ dễ sử dụng cho phép bạn nhận biết được những thay đổi mới nhất trên thị trường và phản ứng kịp thời với các dấu hiệu từ thị trường. Trong dịch vụ của chúng tôi, bạn sẽ luôn tìm thấy các mẫu mới nhất và phù hợp nhất trên bất kỳ cặp nào và bất kỳ khung thời gian nào.
Triple Bottom
was formed on 28.03 at 21:55:08 (UTC+0)
signal strength 1 of 5
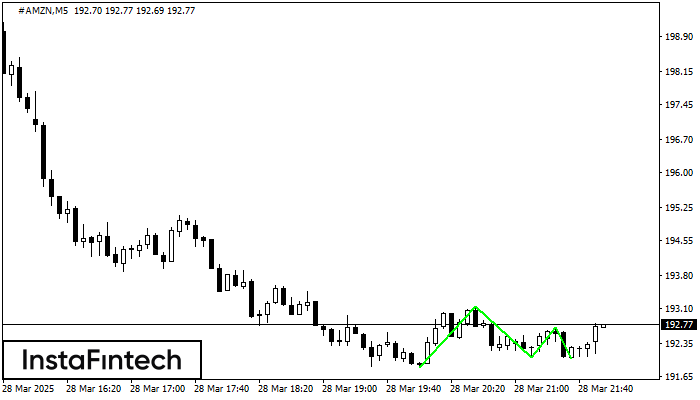
The Triple Bottom pattern has formed on the chart of #AMZN M5. Features of the pattern: The lower line of the pattern has coordinates 193.15 with the upper limit 193.15/192.69, the projection of the width is 131 points. The formation of the Triple Bottom pattern most likely indicates a change in the trend from downward to upward. This means that in the event of a breakdown of the resistance level 191.84, the price is most likely to continue the upward movement.
The M5 and M15 time frames may have more false entry points.
Xem thêm
- All
- All
- Bearish Rectangle
- Bearish Symmetrical Triangle
- Bearish Symmetrical Triangle
- Bullish Rectangle
- Double Top
- Double Top
- Triple Bottom
- Triple Bottom
- Triple Top
- Triple Top
- All
- All
- Buy
- Sale
- All
- 1
- 2
- 3
- 4
- 5
Đáy ba
was formed on 18.04 at 11:50:33 (UTC+0)
signal strength 1 of 5

Mô hình Đáy ba đã được hình thành trên biểu đồ của công cụ giao dịch NZDCAD M5. Mô hình này báo hiệu một sự thay đổi trong xu hướng
Khung thời gian M5 và M15 có thể có nhiều điểm vào lệnh sai hơn.
Open chart in a new window
Đáy ba
was formed on 18.04 at 11:45:33 (UTC+0)
signal strength 2 of 5

Mô hình Đáy ba đã được hình thành trên NZDJPY M15. Nó có các đặc điểm sau: mức kháng cự 84.49/84.47; mức hỗ trợ 84.31/84.32; chiều rộng là 18 điểm
Khung thời gian M5 và M15 có thể có nhiều điểm vào lệnh sai hơn.
Open chart in a new window
Đỉnh đôi
was formed on 18.04 at 11:30:37 (UTC+0)
signal strength 2 of 5
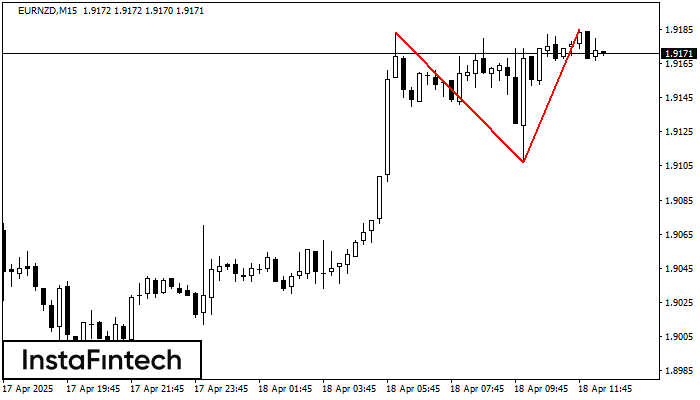
Mô hình đảo chiều Đỉnh đôi đã được hình thành trên EURNZD M15. Đặc điểm: ranh giới trên 1.9183; ranh giới dưới 1.9107; chiều rộng của mô hình
Khung thời gian M5 và M15 có thể có nhiều điểm vào lệnh sai hơn.
Open chart in a new window
