Actual patterns

Patterns are graphical models which are formed in the chart by the price. According to one of the technical analysis postulates, history (price movement) repeats itself. It means that the price movements are often similar in the same situations which makes it possible to predict the further development of the situation with a high probability.
Relevant patterns by InstaTrade is an easy-to-use service which allows you to be aware of latest changes in the market and react to clues from the market in time. In our service you will always find the latest and most relevant patterns on any pair and any timeframe.
Actual Patterns
- All
- All
- Bearish Rectangle
- Bearish Symmetrical Triangle
- Bearish Symmetrical Triangle
- Bullish Rectangle
- Double Top
- Double Top
- Triple Bottom
- Triple Bottom
- Triple Top
- Triple Top
- All
- All
- Buy
- Sale
- All
- 1
- 2
- 3
- 4
- 5
Inverse Head and Shoulder
was formed on 28.04 at 21:45:21 (UTC+0)
signal strength 1 of 5
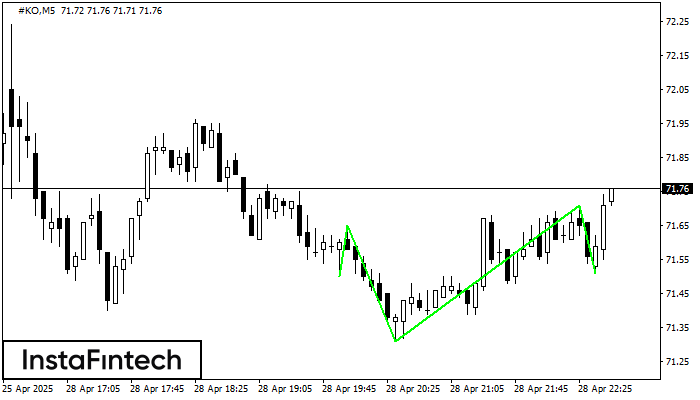
According to the chart of M5, #KO produced the pattern termed the Inverse Head and Shoulder. The Head is fixed at 71.31 while the median line of the Neck
The M5 and M15 time frames may have more false entry points.
Open chart in a new window
Bullish Symmetrical Triangle
was formed on 28.04 at 21:33:12 (UTC+0)
signal strength 4 of 5
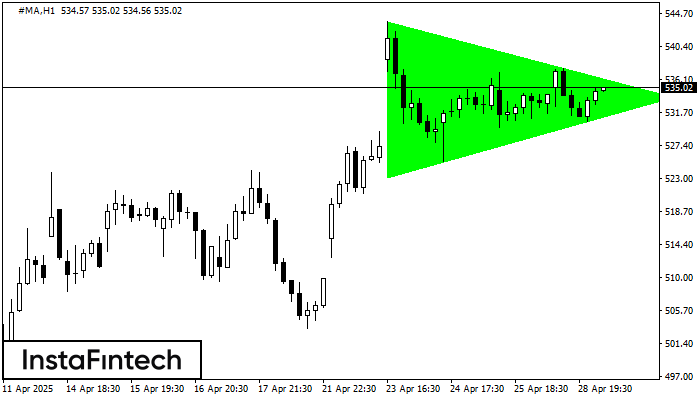
According to the chart of H1, #MA formed the Bullish Symmetrical Triangle pattern. Description: This is the pattern of a trend continuation. 543.69 and 523.21 are the coordinates
Open chart in a new window
Double Bottom
was formed on 28.04 at 21:20:55 (UTC+0)
signal strength 1 of 5
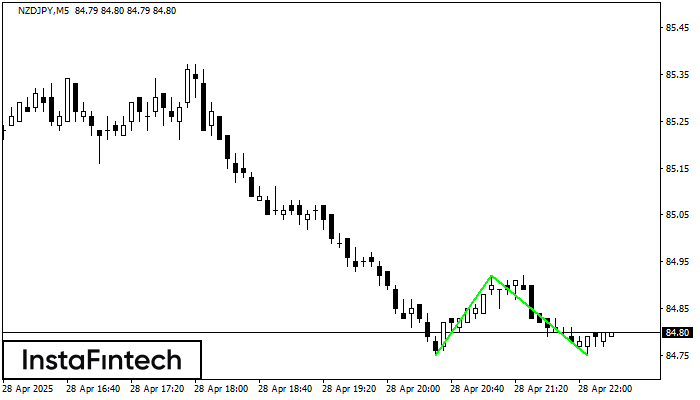
The Double Bottom pattern has been formed on NZDJPY M5. Characteristics: the support level 84.75; the resistance level 84.92; the width of the pattern 17 points. If the resistance level
The M5 and M15 time frames may have more false entry points.
Open chart in a new window
Bearish Rectangle
was formed on 28.04 at 20:16:55 (UTC+0)
signal strength 1 of 5
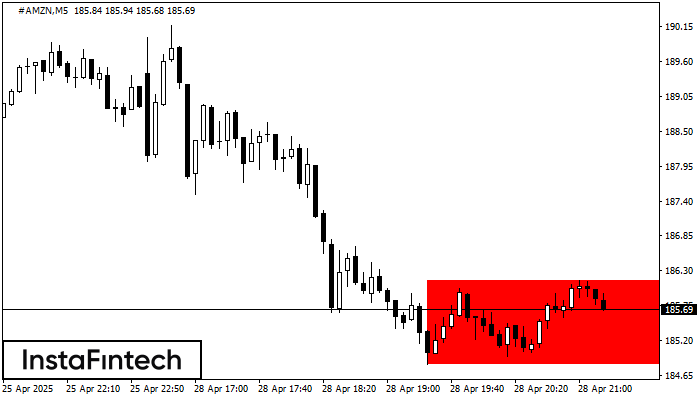
According to the chart of M5, #AMZN formed the Bearish Rectangle. The pattern indicates a trend continuation. The upper border is 186.15, the lower border is 184.83. The signal means
The M5 and M15 time frames may have more false entry points.
Open chart in a new window
Double Bottom
was formed on 28.04 at 20:15:27 (UTC+0)
signal strength 2 of 5
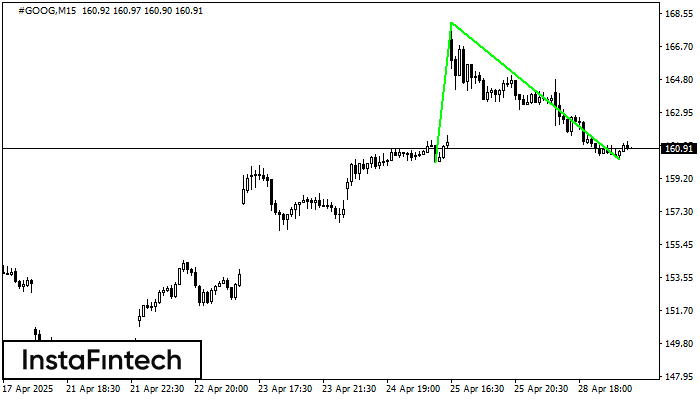
The Double Bottom pattern has been formed on #GOOG M15. Characteristics: the support level 160.09; the resistance level 168.07; the width of the pattern 798 points. If the resistance level
The M5 and M15 time frames may have more false entry points.
Open chart in a new window
Bearish Rectangle
was formed on 28.04 at 20:10:35 (UTC+0)
signal strength 1 of 5
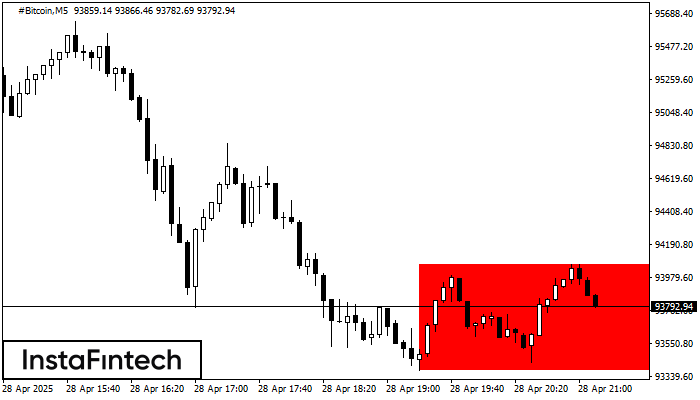
According to the chart of M5, #Bitcoin formed the Bearish Rectangle which is a pattern of a trend continuation. The pattern is contained within the following borders: lower border 93376.97
The M5 and M15 time frames may have more false entry points.
Open chart in a new window
Bullish Symmetrical Triangle
was formed on 28.04 at 20:10:14 (UTC+0)
signal strength 1 of 5
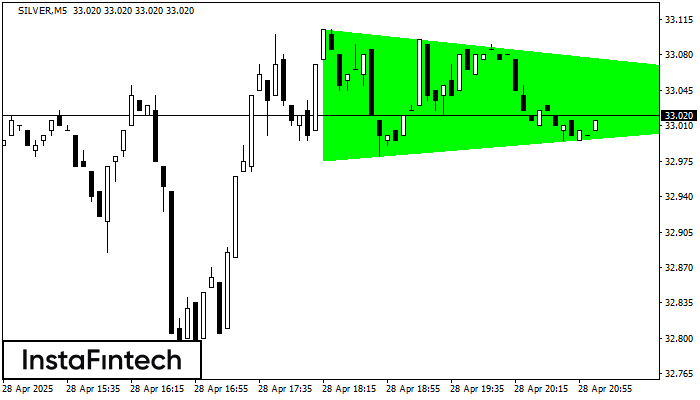
According to the chart of M5, SILVER formed the Bullish Symmetrical Triangle pattern, which signals the trend will continue. Description. The upper border of the pattern touches the coordinates 33.10/33.03
The M5 and M15 time frames may have more false entry points.
Open chart in a new window
Double Bottom
was formed on 28.04 at 20:00:22 (UTC+0)
signal strength 2 of 5
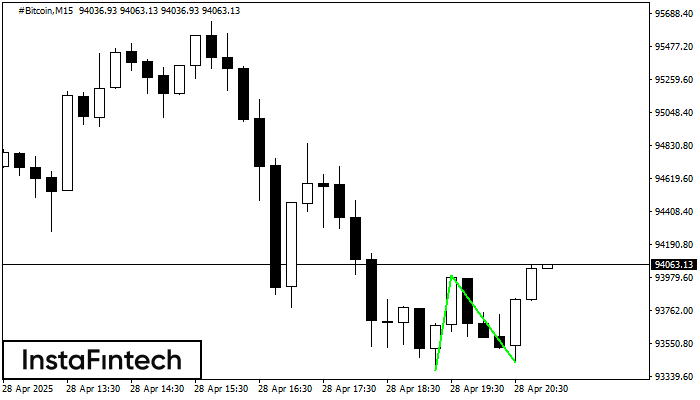
The Double Bottom pattern has been formed on #Bitcoin M15. This formation signals a reversal of the trend from downwards to upwards. The signal is that a buy trade should
The M5 and M15 time frames may have more false entry points.
Open chart in a new window
Double Bottom
was formed on 28.04 at 19:40:14 (UTC+0)
signal strength 1 of 5
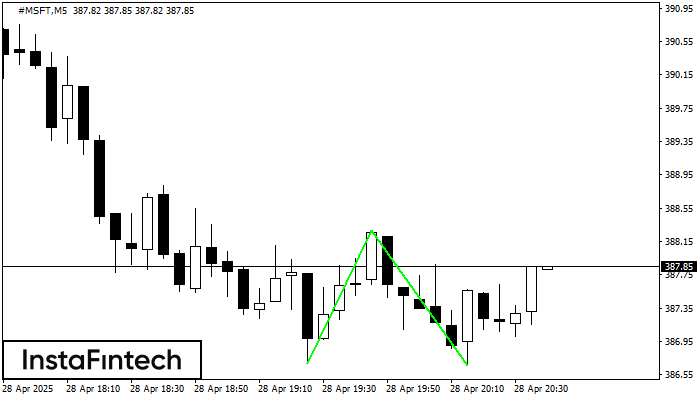
The Double Bottom pattern has been formed on #MSFT M5; the upper boundary is 388.28; the lower boundary is 386.66. The width of the pattern is 159 points. In case
The M5 and M15 time frames may have more false entry points.
Open chart in a new window