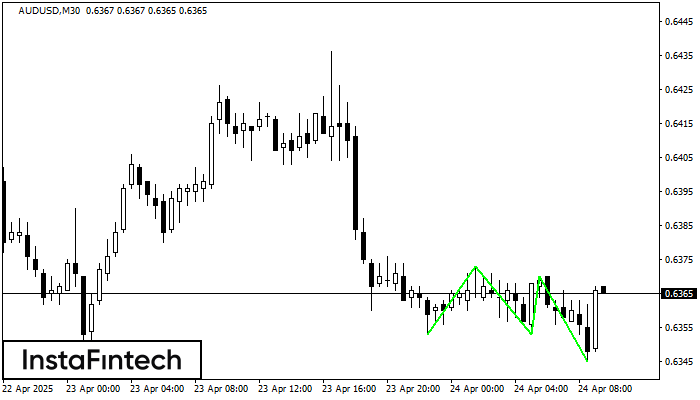
Triple Bottom
was formed on 24.04 at 08:30:33 (UTC+0)
signal strength 3 of 5

The Triple Bottom pattern has formed on the chart of AUDUSD M30. Features of the pattern: The lower line of the pattern has coordinates 0.6373 with the upper limit 0.6373/0.6370, the projection of the width is 20 points. The formation of the Triple Bottom pattern most likely indicates a change in the trend from downward to upward. This means that in the event of a breakdown of the resistance level 0.6353, the price is most likely to continue the upward movement.
- All
- All
- Bearish Rectangle
- Bearish Symmetrical Triangle
- Bearish Symmetrical Triangle
- Bullish Rectangle
- Double Top
- Double Top
- Triple Bottom
- Triple Bottom
- Triple Top
- Triple Top
- All
- All
- Buy
- Sale
- All
- 1
- 2
- 3
- 4
- 5
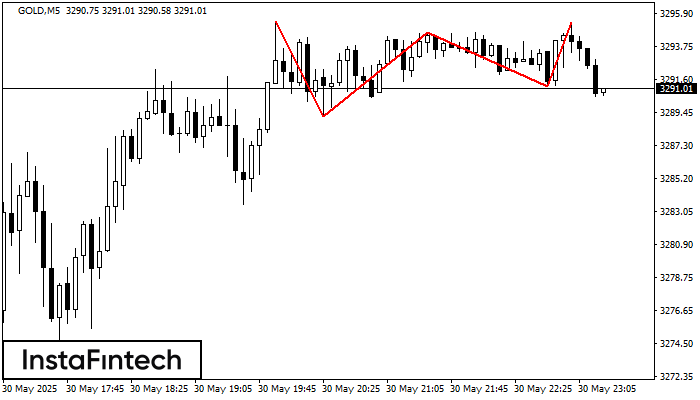
ट्रिपल टॉप
was formed on 30.05 at 22:20:23 (UTC+0)
signal strength 1 of 5
ट्रिपल टॉप पैटर्न GOLD M5 ट्रेडिंग इंस्ट्रूमेंट के चार्ट पर बना है। यह एक रीवर्सल पैटर्न है जिसमें निम्नलिखित विशेषताएं हैं: प्रतिरोध स्तर 4, समर्थन स्तर -193, और पैटर्न की
M5 और M15 समय सीमा में अधिक फाल्स एंट्री पॉइंट्स हो सकते हैं।
Open chart in a new window
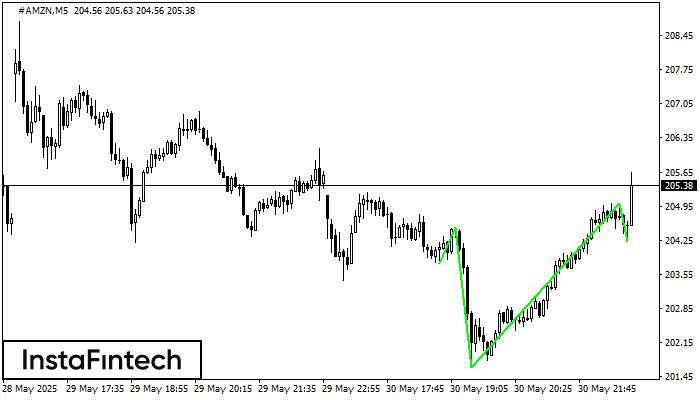
इन्वर्स हेड एण्ड शोल्डर्स
was formed on 30.05 at 21:50:24 (UTC+0)
signal strength 1 of 5
M5 के चार्ट के अनुसार, #AMZN से इन्वर्स हेड एण्ड शोल्डर्स पैटर्न बना। हेड 201.64 पर स्थित है जबकि नेक की मध्य रेखा 204.52/205.01 पर सेट है। इन्वर्स हेड एण्ड
M5 और M15 समय सीमा में अधिक फाल्स एंट्री पॉइंट्स हो सकते हैं।
Open chart in a new window
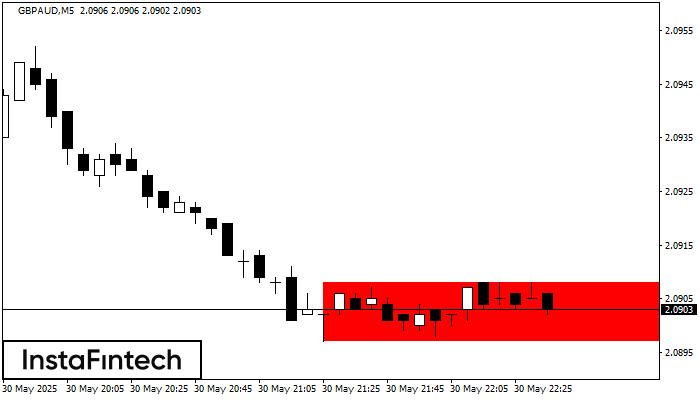
बियरिश आयत
was formed on 30.05 at 21:36:36 (UTC+0)
signal strength 1 of 5
M5 के चार्ट के अनुसार, GBPAUD से बियरिश आयत बना जो प्रवृत्ति निरंतरता का पैटर्न है। पैटर्न निम्न सीमाओं के भीतर समाहित है: निचली सीमा 2.0897 – 2.0897 और ऊपरी
M5 और M15 समय सीमा में अधिक फाल्स एंट्री पॉइंट्स हो सकते हैं।
Open chart in a new window


