รูปแบบกราฟ

รูปแบบกราฟนั้นเป็น รูปจำลองทางกราฟฟิกที่ถูกสร้างขึ้นมาในชาร์ตจากราคา อ้างอิงตามหนึ่งในการวิเคราะห์ทางเทคนิค ที่ตั้งสมมติฐานมาว่า ประวัติศาสตร์ (การเคลื่อนไหวของราคา) มักจะเกิดขึ้นซ้ำรอยเดิม นั้นหมายความว่า การเคลื่อนไหวของราคาก็หมือนกับ สถานการณ์หนึ่งที่จะสามารถทำการคาดการณ์ไปยังทิศทางในอนาคต ตามเหตุการณ์ที่น่าจะมีความเป็นไปได้สูง
รูปแบบกราฟที่สำคัญจากทาง InstaTrade นั้นจะเป็นการบริการที่มีการใช้อย่างง่ายดาย ซึ่งจะช่วยให้คุณสามารถทราบถึงการเปลี่ยนแปลงล่าสุด ในตลาดได้ และสามารถรับมือกับข้อมูลจากทางตลาดได้ทันท่วงที ในการบริการของพวกเรานั้น คุณจะพบกับรูปแบบกราฟล่าสุดและมีความสำคัญมากที่สุดในทุกๆคู่สกุลเงิน และทุกๆขอบเขตเวลา
Bearish Flag
was formed on 01.04 at 12:50:23 (UTC+0)
signal strength 1 of 5

The Bearish Flag pattern has been formed on the chart USDCHF M5. Therefore, the downwards trend is likely to continue in the nearest term. As soon as the price breaks below the low at 0.8817, traders should enter the market.
The M5 and M15 time frames may have more false entry points.
ดูเพิ่มเติม
- All
- All
- Bearish Rectangle
- Bearish Symmetrical Triangle
- Bearish Symmetrical Triangle
- Bullish Rectangle
- Double Top
- Double Top
- Triple Bottom
- Triple Bottom
- Triple Top
- Triple Top
- All
- All
- Buy
- Sale
- All
- 1
- 2
- 3
- 4
- 5
รูปแบบกราฟจุดสองยอดขาลง (Double Bottom)
was formed on 11.04 at 17:34:45 (UTC+0)
signal strength 1 of 5
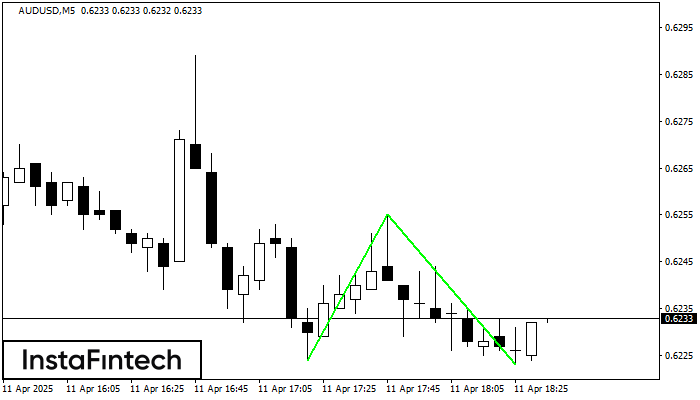
รูปแบบ รูปแบบกราฟจุดสองยอดขาลง (Double Bottom) ถูกสร้างขึ้นมาใน AUDUSD M5 คุณลักษณะ: ระดับของแนวรับ 0.6224; ระดับของแนวต้าน 0.6255; ความกว้างของรูปแบบ 31 จุด
ขอบเตระยะเวลาใน M5 และ M15 อาจจะมีตำแหน่งการเข้าใช้งานที่ผิดพลาดมากยิ่งขึ้น
Open chart in a new window
รูปแบบกราฟจุดสามยอดขาลง (Triple Bottom)
was formed on 11.04 at 17:29:53 (UTC+0)
signal strength 1 of 5
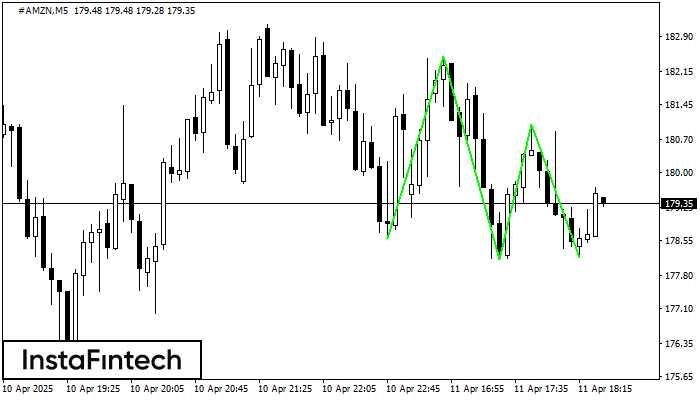
รูปแบบ รูปแบบกราฟจุดสามยอดขาลง (Triple Bottom) ได้สร้างขึ้นมาในชาร์ตของ #AMZN M5 ลักษณะของกราฟรูปแบบนี้: เส้นด้านล่างของกราฟรูปแบบนี้มีพิกัดอยู่ที่ 182.48 พร้อมกับลิมิตด้านบน 182.48/181.03,ระยะของความกว้างคือ 388 จุด การก่อตัวของกราฟรูปแบบ
ขอบเตระยะเวลาใน M5 และ M15 อาจจะมีตำแหน่งการเข้าใช้งานที่ผิดพลาดมากยิ่งขึ้น
Open chart in a new window
รูปแบบกราฟหัวและหัวไหล่แบบกลับหัว (Inverse Head and Shoulder)
was formed on 11.04 at 15:59:57 (UTC+0)
signal strength 3 of 5

อ้างอิงจากชาร์ตของ M30, AUDCHF ที่ได้สร้างรูปแบบตาม รูปแบบกราฟหัวและหัวไหล่แบบกลับหัว (Inverse Head and Shoulder) ตำแหน่งของหัวอยู่ใน 0.5043 ระหว่างนั้นเส้นระดับกลางของตำแหน่งคอ อยู่ในระดับที่ 0.5120/0.5113 การก่อตัวของรูปแบบ
Open chart in a new window