Pola sebenarnya

Actual Patterns
- All
- All
- Bearish Rectangle
- Bearish Symmetrical Triangle
- Bearish Symmetrical Triangle
- Bullish Rectangle
- Double Top
- Double Top
- Triple Bottom
- Triple Bottom
- Triple Top
- Triple Top
- All
- All
- Buy
- Sale
- All
- 1
- 2
- 3
- 4
- 5
Bawah Ganda
was formed on 28.04 at 22:00:24 (UTC+0)
signal strength 2 of 5
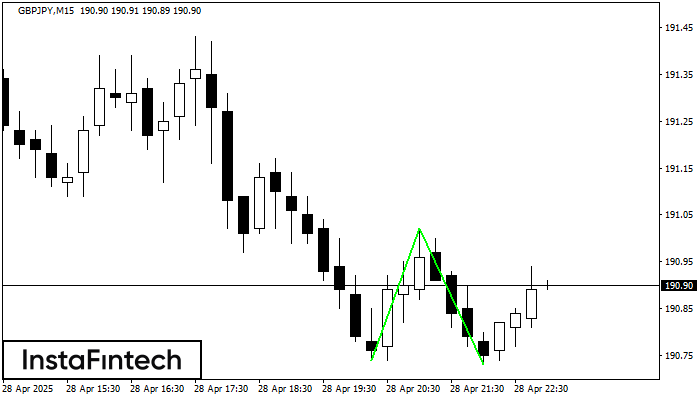
Pola Bawah Ganda telah terbentuk pada GBPJPY M15. Formasi ini mensinyalkan reversal tren dari arah penurunan ke arah kenaikan. Sinyal menunjukkan bahwa transaksi beli harus dibuka setelah batas atas pola
Rangka waktu M5 dan M15 mungkin memiliki lebih dari titik entri yang keliru.
Open chart in a new window
Kepala dan Bahu Terbalik
was formed on 28.04 at 21:45:21 (UTC+0)
signal strength 1 of 5
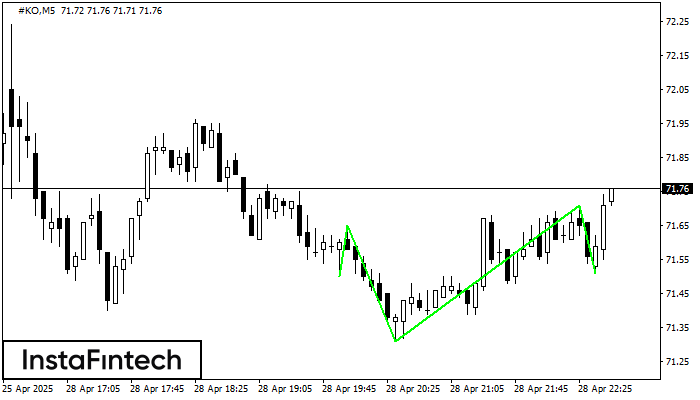
Menurut grafik M5, #KO menghasilkan pola yang disebut Kepala dan Bahu Terbalik. The Head ditetapkan di 71.31 sementara garis median The Neck ditetapkan di 71.65/71.71. Formasi Pola Kepala dan Bahu
Rangka waktu M5 dan M15 mungkin memiliki lebih dari titik entri yang keliru.
Open chart in a new window
Segitiga Simetris Bullish
was formed on 28.04 at 21:33:12 (UTC+0)
signal strength 4 of 5
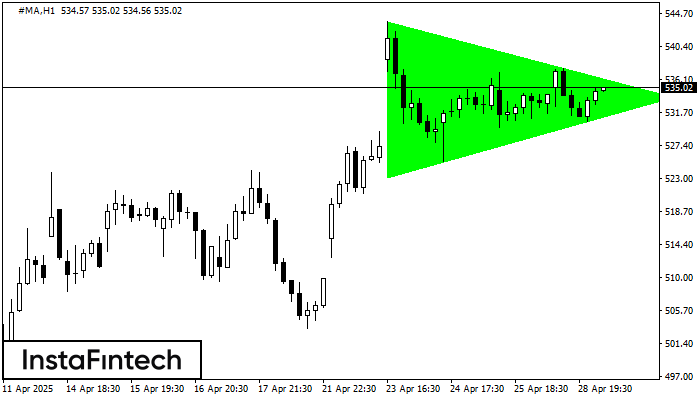
Menurut Grafik dari H1, #MA dibentuk pola Segitiga Simetris Bullish. Deskripsi: Ini merupakan pola dari kelanjutan tren. 543.69 dan 523.21 adalah kordinat masing-masing dari batas atas dan lebih rendah. Lebar
Open chart in a new window
Bawah Ganda
was formed on 28.04 at 21:20:55 (UTC+0)
signal strength 1 of 5
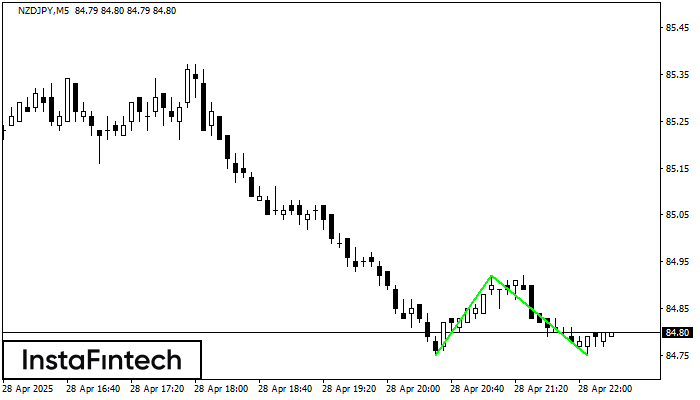
Pola Bawah Ganda telah terbentuk pada NZDJPY M5. Karakteristik: level support 84.75; level resistance 84.92; lebar pola 17 poin. Jika level resistance ditembus, perubahan dalam tren dapat diprediksi dengan target
Rangka waktu M5 dan M15 mungkin memiliki lebih dari titik entri yang keliru.
Open chart in a new window
Persegi Bearish
was formed on 28.04 at 20:16:55 (UTC+0)
signal strength 1 of 5
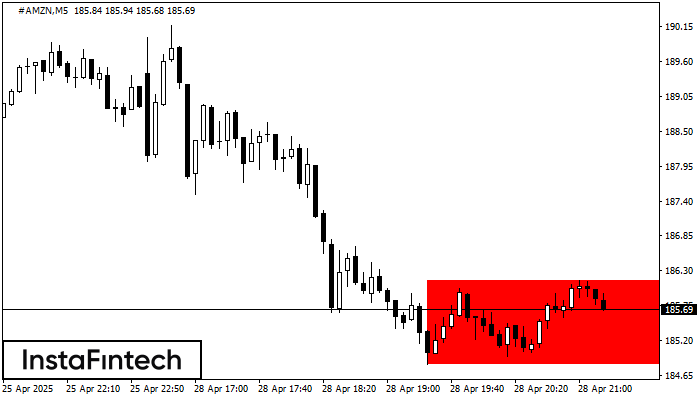
Menurut grafik dari M5, #AMZN terbentuk Persegi Bearish. Pola menunjukkan kelanjutan tren. Batas atas adalah 186.15, batas rendah adalah 184.83. Sinyal berarti posisi jual harus dibuka setelah menetapkan harga dibawah
Rangka waktu M5 dan M15 mungkin memiliki lebih dari titik entri yang keliru.
Open chart in a new window
Bawah Ganda
was formed on 28.04 at 20:15:27 (UTC+0)
signal strength 2 of 5
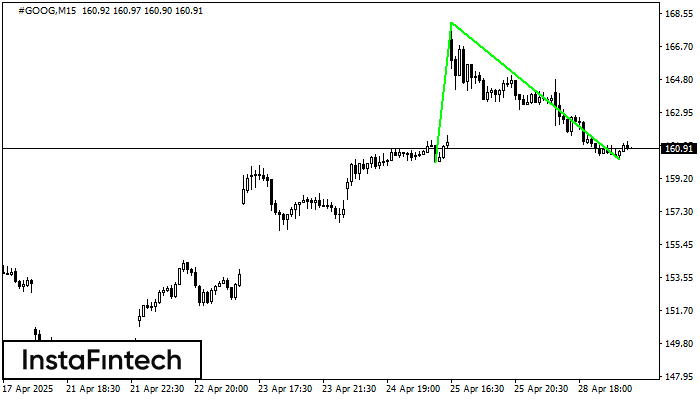
Pola Bawah Ganda telah terbentuk pada #GOOG M15. Karakteristik: level support 160.09; level resistance 168.07; lebar pola 798 poin. Jika level resistance ditembus, perubahan dalam tren dapat diprediksi dengan target
Rangka waktu M5 dan M15 mungkin memiliki lebih dari titik entri yang keliru.
Open chart in a new window
Persegi Bearish
was formed on 28.04 at 20:10:35 (UTC+0)
signal strength 1 of 5
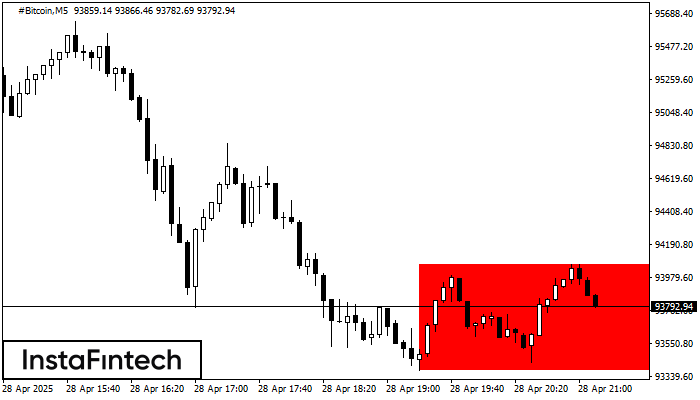
Menurut grafik dari M5, #Bitcoin terbentuk Persegi Bearish yang merupakan pola dari kelanjutan tren. Pola terkandung di dalam batas berikut: batas lebih rendah 93376.97 – 93376.97 dan batas atas 94063.13
Rangka waktu M5 dan M15 mungkin memiliki lebih dari titik entri yang keliru.
Open chart in a new window
Segitiga Simetris Bullish
was formed on 28.04 at 20:10:14 (UTC+0)
signal strength 1 of 5
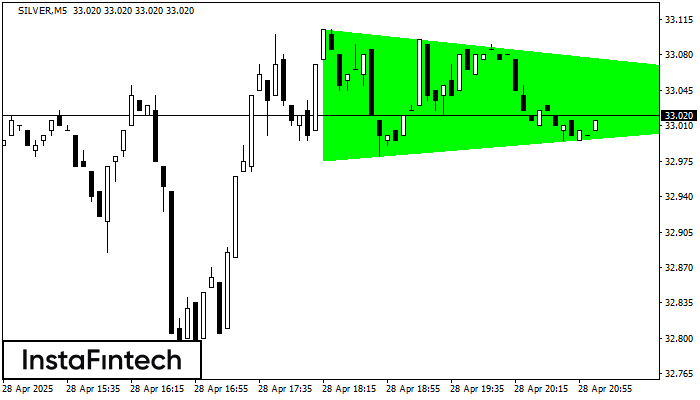
Menurut Grafik dari M5, SILVER dibentuk pola Segitiga Simetris Bullish, yang menunjukkan tren akan berlanjut. Deksripsi. Batas atas dari pola menyentuh kordinat 33.10/33.03 dimana batas yang lebih rendah berada sepanjang
Rangka waktu M5 dan M15 mungkin memiliki lebih dari titik entri yang keliru.
Open chart in a new window
Bawah Ganda
was formed on 28.04 at 20:00:22 (UTC+0)
signal strength 2 of 5
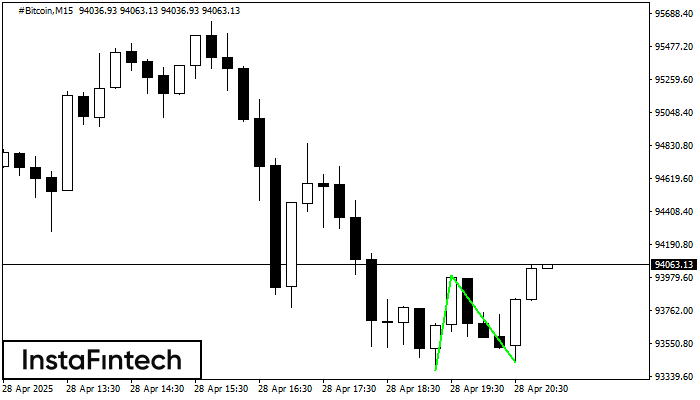
Pola Bawah Ganda telah terbentuk pada #Bitcoin M15. Formasi ini mensinyalkan reversal tren dari arah penurunan ke arah kenaikan. Sinyal menunjukkan bahwa transaksi beli harus dibuka setelah batas atas pola
Rangka waktu M5 dan M15 mungkin memiliki lebih dari titik entri yang keliru.
Open chart in a new window